Chapter 5 Arrests by Age, Sex, and Race
The Arrests by Age, Sex, and Race data set (ASR)40 provides monthly counts of arrests broken down by age, sex, and race for a variety of crimes. This data includes a broader number of crime categories than the crime data set (the Offenses Known and Clearances by Arrest data) though is less detailed on violent crimes since it does not breakdown aggravated assault or robberies by weapon type as the Offenses Known data does.
For each crime it says the number of arrests for each sex-age group with younger ages (15-24) showing the arrestee’s age to the year (e.g. age 16, age 17) and other ages grouping years together (e.g. age 25-29, 30-34, “under 10”). It also breaks down arrests by race-age by including the number of arrestees of each race (American Indian, Asian, Black, and White are the only included races) and if the arrestee is a juvenile (<18 years old) or an adult. The data does technically include a breakdown by ethnicity-age (e.g. juvenile-Hispanic, juvenile-non-Hispanic) but almost no agencies report this data and most do not report ethnicity at all. So in practice the data does not include ethnicity. As the data includes counts of arrestees, people who are arrested multiple times are included in the data multiple times; it is not a measure of unique arrestees.
5.1 Agencies reporting
This data is available from 1974 through 2022 though after 2020 the measure for how many months of data an agency reported changed so post-2020 data is difficult to compare to 2020 and earlier.41 Figure 5.1 shows how many agencies reported at least one month of the year and every month of the year for 1974-2020.
The first year of data has about 9,000 agencies reporting at least one month and that increases strongly to a little over 13,000 in the late 1970s, staying fairly steady until decreasing in the late 1980s then increasing in the 2000s until approximately 15,000 agencies report. The number of agencies reporting 12 months of data follows a similar trend, but at a lower level with about 4,000 fewer agencies each year. This 15,000, however, still remains under the estimated 18,000 police agencies in the United States and below the reporting rates of UCR data such as the Offenses Known and Clearances by Arrest data. This data is also missing some important cities such as New York City which has not reported even a single month since 2002 and Chicago which tends to only report a single month if at all.
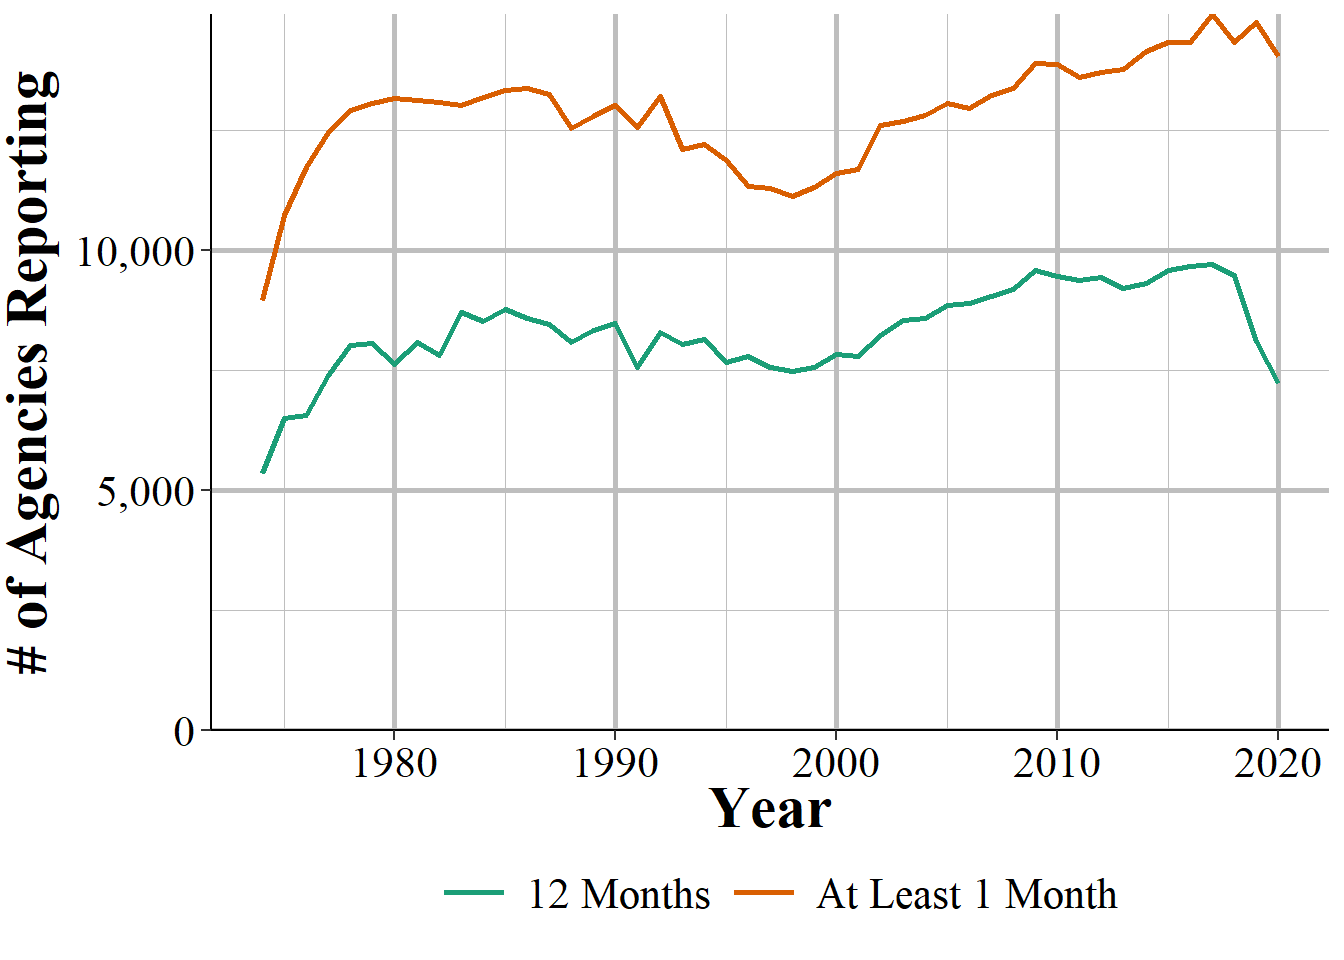
Figure 5.1: The annual number of agencies reporting at least one month of data and 12 months of data in that year.
5.2 What is an arrest? (what unit is this data in?)
This data set counts each arrest separately, meaning that individuals who are arrested multiple times will be counted multiple times. It reports the most serious crime for each arrest incident, so if someone commits multiple crimes during an incident, only the most serious one is recorded. Consider for example, a person who robs a bank, shooting and killing a guard and pointing their gun at other people in the bank. They are arrested and then released from jail (just imagine that this is true) and are then arrested the next day for shoplifting. And let us further assume that both arrests were in the same month in the same agency. How many arrests are here? They committed multiple crimes in the first incident (murder, robbery, aggravated assault) but in this data set they would only be classified as an arrest for the most serious crime, murder. And then separately they would also be an arrested for shoplifting. So assuming that no other arrests occurred in that police agency that month, there would be two arrests reported: one for murder and one for shoplifting.
There’s no way to tell how many unique people were arrested, or of those arrested multiple times which crimes they were arrested for. So if you have 100 arrests there may be 1 person arrested 100 times or 100 people arrested once - though, of course, the true number is likely somewhere in between. This means that studies that try to use this data as a measure of unique people or even the percent of arrestees by group (age, sex, or race) relative to some base rate of the population such as the number of people living in that city are going to be wrong - though how wrong is unclear.
Common uses of this data - more common in more news articles or advocacy group reports than in peer-reviewed research articles - compare the percent of arrestees of a certain group to the percent of a city’s population of that group. Any differences between the arrestee percent and the resident percent is, according to these reports, evidence of a disparity. This is most common for looking at differences by race.42 For example, say a city is equally split between Black and White residents (and no other races are present, for the simplicity of this example). If >50% of arrestees for a particular crime are Black, that is often cited as evidence of anti-Black discrimination.
There are two assumptions built into this. First, that offending rates are identical between Black and White residents; second, that reoffending rates are identical. If, for example, Black people in this example commit that crime at higher rates than White people then all else being equal you would expect this group to have a higher share of arrests than their share of the resident population. Second, it assumes that people of each race are rearrested at similar rates. Put another way, it assumes that if 100 Black people are arrested and 100 White people are arrested, there are an equal number of unique people in each group. If these assumptions are violated - and they certainly are violated to some degree in every use of the data - the conclusions will be wrong. Whether this distinction between arrests and unique people arrested affects your interpretation of the data depends on the study you are doing, but it is important to consider in your research. One way to address this is to use other data on the rate of rearrest by group, though you would have to be very careful to not extrapolate the results of the other study too far beyond what they could tell you about the specific time and place they studied.
Another solution would be to try to bound results, such as calculating how extreme your assumptions (e.g. assuming how different the true offense rates between races are) can be for your conclusions to still hold. Going back to the example of a city with 50% White and 50% Black people, say that there are 10 arrests with a split of 1 White and 9 Black arrestees. If offense rates are identical you would expect 5 White and 5 Black people arrested, not a disparity of 9 to 1. So you could say that this disparity is reasonable if the Black people commit this offense at a rate of nine times as often than White people.43
Is this bounding assumption reasonable? In this context-less example, I have no idea. There certainly may be cases where it is reasonable but that is context dependent. And you need to understand the context of what you are studying. Numbers are not enough. If based on your understanding of the context of what you are studying you believe that it is unreasonable that Black people commit that offense at a rate nine times that of White people, then you may conclude that the disparity is not explained by differences in offending rates. Your next step is to identify another explanation and try to rule that out too.
5.2.1 The Hierarchy Rule
The Hierarchy Rule is used in this data which means that when someone is arrested for multiple crimes, only the most serious crime is recorded. For example, if a person commits murder, robbery, and theft, only the murder is reported. Essentially, the FBI chose seven crimes in 1929 that they call Index Crimes - or sometimes called Part I crimes - and these were considered the most important crimes to be recorded.44 If a person is arrested for multiple crimes and an Index Crime is one of those crimes, then the Index Crime at the top of the Hierarchy is the one recorded in this data. Below I have listed all crimes included in this data set and the crimes 1-7 as well as 9 (arson) are the Index Crimes. The top of the Hierarchy is the crime with the lowest number. So murder is always reported in incidents where there is a murder; rape is always reported when there is an incident with rape but no murder; etc.
The remaining crimes - the ones that are not Index crimes - are called Part II crimes and are not arranged in any particular way. So a lower value numbered crime is not higher on the Hierarchy than a higher value number - Part II crimes do not follow the Hierarchy. If all of the crimes in an incident are Part II crimes then the agency must decide for themselves which crime is the most serious. This can lead to agencies deciding their own hierarchy differently than others which makes this data much less comparable across agencies than if there was a standard rule.45
- Homicide
- Murder and non-negligent manslaughter
- Manslaughter by negligence
- Rape
- Robbery
- Aggravated assault
- Burglary
- Theft (other than of a motor vehicle)
- Motor vehicle theft
- Simple assault
- Arson
- Forgery and counterfeiting
- Fraud
- Embezzlement
- Stolen property - buying, receiving, and possessing
- Vandalism
- Weapons offenses - carrying, possessing, etc.
- Prostitution and commercialized vice
- Sex offenses - other than rape or prostitution
- Drug abuse violations - total
- Drug sale or manufacturing + Opium and cocaine, and their derivatives (including morphine and heroin) + Marijuana + Synthetic narcotics + Other dangerous non-narcotic drugs b Drug possession + Opium and cocaine, and their derivatives (including morphine and heroin) + Marijuana + Synthetic narcotics + Other dangerous non-narcotic drugs
- Gambling - total
- Bookmaking - horse and sports
- Number and lottery
- All other gambling
- Offenses against family and children - nonviolent acts against family members. Includes neglect or abuse, nonpayment of child support or alimony.
- Driving under the influence (DUI)
- Liquor law violations - Includes illegal production, possession (e.g. underage) or sale of alcohol, open container, or public use laws. Does not include DUIs and drunkenness.
- Drunkenness - i.e. public intoxication
- Disorderly conduct
- Vagrancy - includes begging, loitering (for adults only), homelessness, and being a “suspicious person.”
- All other offenses (other than traffic) - a catch-all category for any arrest that is not otherwise specified in this list. Does not include traffic offenses. Very wide variety of crimes are included - use caution when using!
- Suspicion - “Arrested for no specific offense and released without formal charges being placed.”
- Curfew and loitering law violations - for minors only.
- Runaways - for minors only.
In incidents where the arrestee committed both an Index Crime and a Part II crime, then only the top Index Crime is recorded. This can lead to rather silly results since some Part II crimes are certainly more serious than some Index Crimes. Consider, for example, a person arrested for simple assault, carrying a firearm, pimping, and theft. The first three crimes are, in my opinion, clearly more serious than theft. But since theft is an Index Crime, this person would be considered to have been arrested for theft.
5.3 Important variables
This data has the standard set of variables describing the agency that is reporting. This includes the agency ORI - which is the unique ID for that agency - the agency name, their state, the population under their jurisdiction, and the month and year of the data.
For each crime this data provides the number of arrests in that month (or year for the annual data) broken down by age (within this, by sex), by race (within this, by if they are a juvenile or an adult), and by ethnicity though this is an enormously flawed variable. Finally, we also know the number of juvenile arrests that ended in a few possible outcomes (e.g. released without charges, referred to juvenile court), though we do not know the crime that led to these arrests. We will get into each of these variables below.
5.3.1 Age
The data set provides the number of arrests for each age group and sex Specific ages are reported for younger individuals (e.g., 15-24), while older individuals are grouped into broader age ranges (e.g., 25-29, 30-34). Male and female arrestees are reported separately, and the data set does not include any category for non-binary or transgender individuals. To get a total arrests for that crime for that age, just add the female and male variables together. Below are the ages or age categories included in the data, and these are the same for female and male arrestees.
- Under 10
- 10-12
- 13-14
- 15
- 16
- 17
- 18
- 19
- 20
- 21
- 22
- 23
- 24
- 25-29
- 30-34
- 35-39
- 40-44
- 45-49
- 50-54
- 55-59
- 60-64
- 65 and older
One way to use this data is to look at the age-crime curve of offending. The age-crime curve is a criminological finding that crime trends to increase in the early teenage years to peaking around age 18 before declining sharply. So essentially people commit crime as teenagers and then tend to fizzle out (or go to prison) as they get older.
Figure 5.2 shows this trend for male arrestees of rape in Philadelphia from 1974-2023, which is every year of data we have available. A major problem with this figure is that some of the ages are for single years and some are for age categories. In the graph there were 793 arrests for rape for people aged 24. The next age is the category of aged 25-29 and there were 3,604 arrests for this age group. One way to address this is to assume that each age in the category has the same number of arrests, so dividing 3,604 by 5 gives us about 721 arrests per age. Assuming equal arrests by age, however, is not consistent with either the literature on the age-crime curve or the findings in this figure for previous ages, as the number of arrests by age is, overall, going down since age 18. So instead of assuming equality, would we assume that older ages have fewer arrests than younger ages (maybe taking the percent change from the previous years where we do have individual ages available)? This is a tricky question to answer and it makes these kinds of analyses really hard to do - and very imprecise since all of your assumptions will be wrong, though hopefully not too wrong.
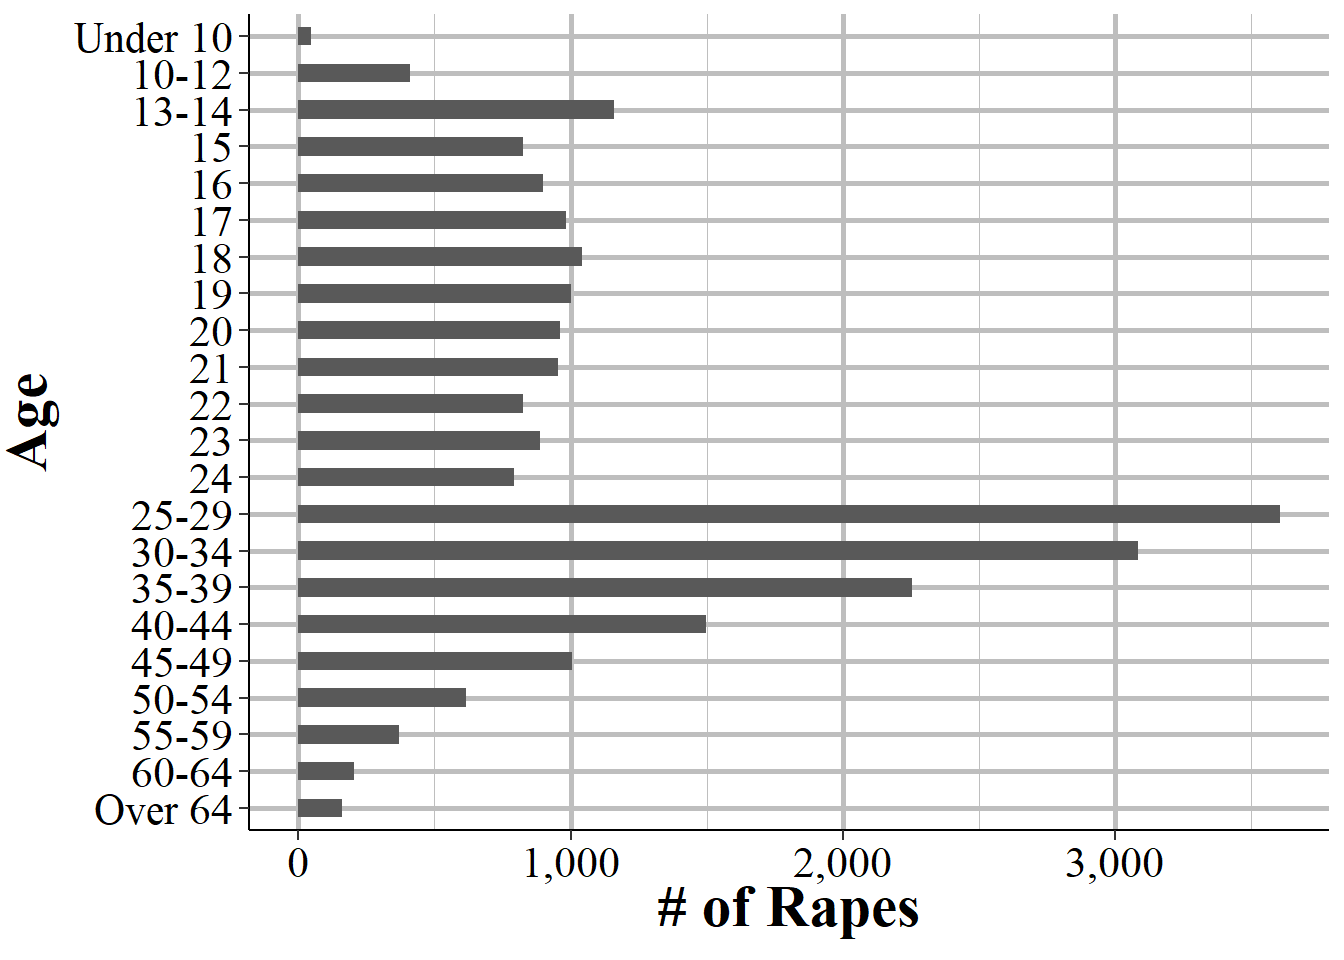
Figure 5.2: The total number of rapes by male arrestees reported by arrestee age in Philadelphia, 1974-2023.
5.3.2 Race
The data set categorizes arrests by race: American Indian, Asian, Black, and White. It does not account for mixed-race individuals or provide details on how race was determined (e.g., officer perception or arrestee self-reporting). This is further broken down into if the arrestee was an adult (18 years or older) or a juvenile (under 18).
Whether the arrestee is Hispanic is in a separate (and nearly universally non-reported variable). Since the ethnicity variable is separate, and since the data is not at the arrestee-level unit, there is no way to interact the race and ethnicity variables. So, for example, there is no way to determine how many White-Hispanic or White-Non-Hispanic arrestees. Just total White arrestees and total Hispanic arrestees.
As with race variables in other UCR data sets - and, really, any data set - you should be cautious about using this variables since it is the officer’s perception of the arrestee’s race - though of course some arrests do have other data about the arrestee’s race such as what they tell the officer. In cases where the arrestee is carrying identification such as a driver’s license this variable is likely to be extremely well reported. However, we cannot tell from this data whether the race is based on something like a license or is merely the officer’s perception.46
Even though there is information about the specific age of arrestee (or the age range, depending on the arrestee’s age) and their sex, there is no sex information combined with race and no age beyond the adult/juvenile binary. If you add up all arrests that are broken down by sex-age and compare it to the sum of all of the arrests broken down by adult/juvenile-race here, in some cases these numbers do not add up. That is because while most agencies do report the age variables, not all agencies report the race variables. So summing up the race variables will actually undercount the total number of arrests.
- American Indian
- Asian
- Black
- White
Figure 5.3 shows one example of an analysis of this data by showing the percent of arrests of adults for marijuana possession by the arrestee’s race in Philadelphia for all years of data we have with a full year of data reported, 1976-2018 At the bottom are American Indian and Asian arrestees who make up nearly none of the arrests for this crime. Black arrestees, shown in green, make up the bulk of arrests with only a few years making up under 60% of arrests and growing to around 80% of arrests since the mid-2000s. As White arrestees, shown in orange, are the only other race category included, they make up a near perfect mirror image of Black arrestees, composing of around 40% of arrests until decreasing starting in the 1990s to end up with about 20% of arrests in recent years.
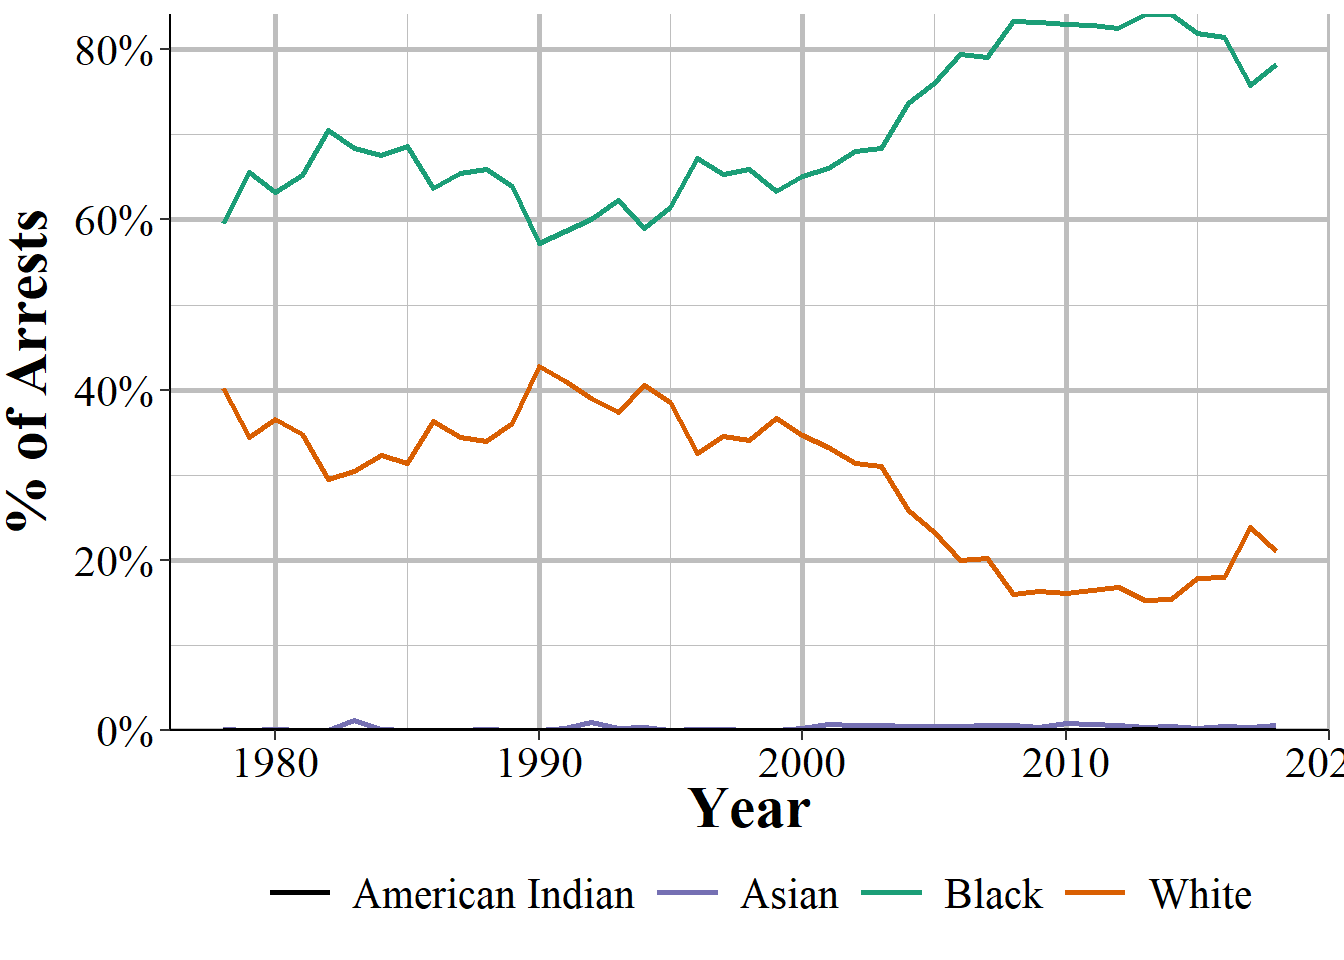
Figure 5.3: The annual percent of adult marijuana possession arrests in Philadelphia by arrestee race, 1978-2018.
Interestingly, while the disparity between Black-White arrests has grown dramatically in recent decades, the total number of arrests have a very different trend as shown in Figure 5.4. Total marijuana possession arrests declined in the mid-1980s then increased in the mid-1990s from only a few hundred arrests in the early 1990s to nearly 5,000 arrests in 2010 before dropping precipitously to under 700 each year in the late-2010s.
Yet throughout this latter period as a percent of arrests, Black people consistently grew for years before plateauing around 2007 with a small decline in the last few years of full data. Philadelphia decriminalized marijuana possession in 2014 under Mayor Nutter which is right when the steepest decline in arrests happened. This suggests that who is arrested, in terms of race, is relatively unrelated to the total number of arrests, at least for marijuana in Philadelphia.
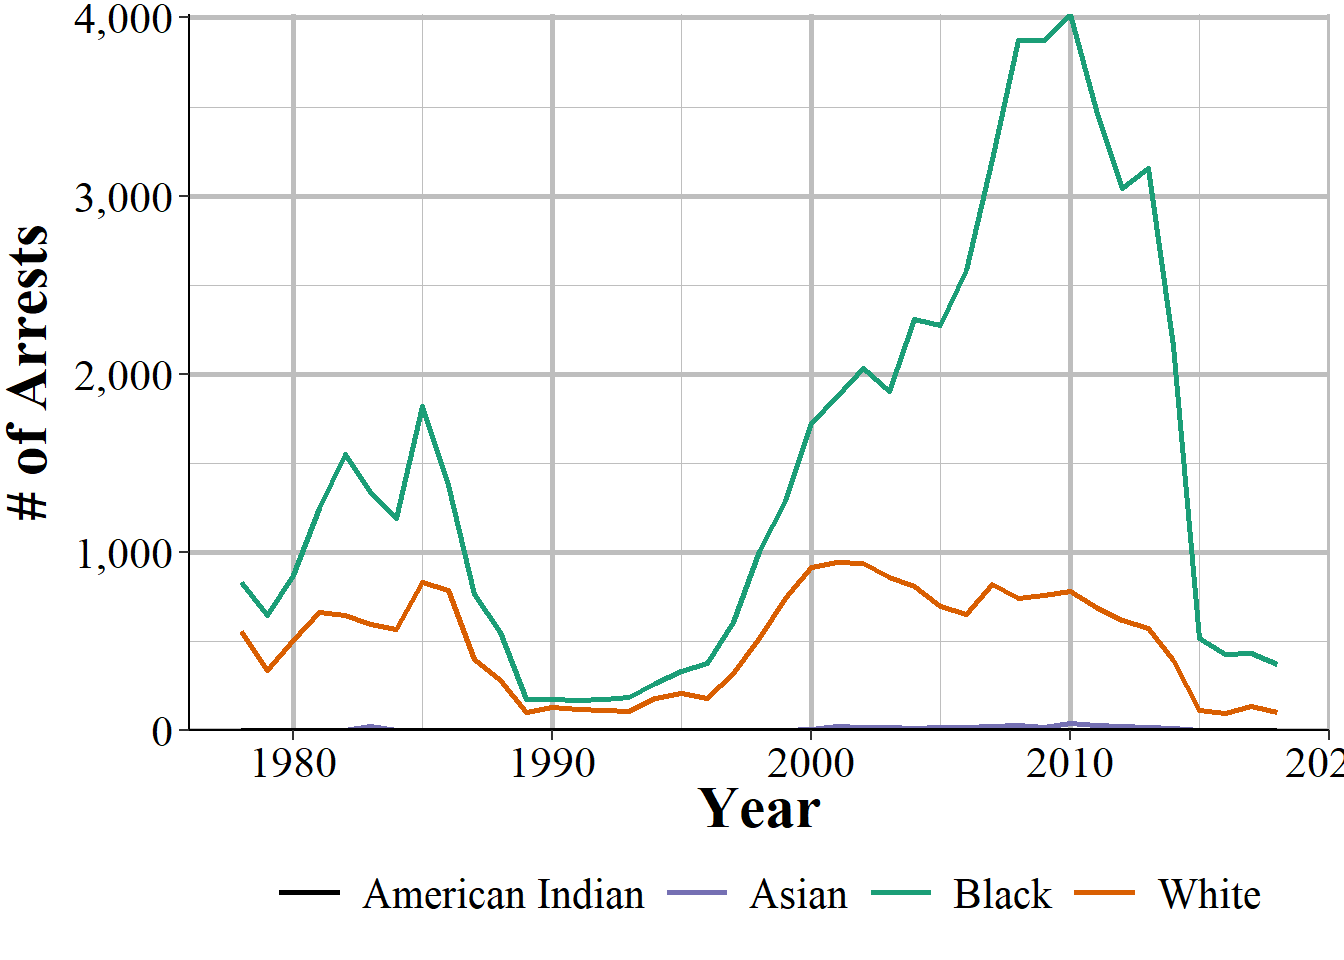
Figure 5.4: The annual number of adult marijuana possession arrests in Philadelphia by arrestee race, 1978:2018.
5.3.3 Ethnicity
While technically included, the ethnicity variable is largely useless since for most years no agencies reported it and for the years where agencies do report ethnicity, not all agencies do so. The ethnicities included are Hispanic and non-Hispanic and are broken down by if the arrestee is an adult (18+ years old) or a juvenile (<18 years old).
- Adult
- Hispanic
- Non-Hispanic
- Juvenile
- Hispanic
- Non-Hispanic
Figure 5.5 shows the annual number of Hispanic arrestees for theft for all agencies that reported any data that year.47 For several years no agencies reported until the number of Hispanic arrestees start climbing in 1980 and peaks in 1986 at about 136,000 arrestees. Then there are zero Hispanic arrestees for a few years, four Hispanic arrestees in 1990 and two non-Hispanic arrests in 1991, and then again zero Hispanic arrestees, this time for decades. Only in 2017 do the number of Hispanic theft arrestees begin to creep up. From 2017 to 2022 (the last year available at the time of this writing) there are Hispanic arrestees reported every year, though now only about 60,000 per year.
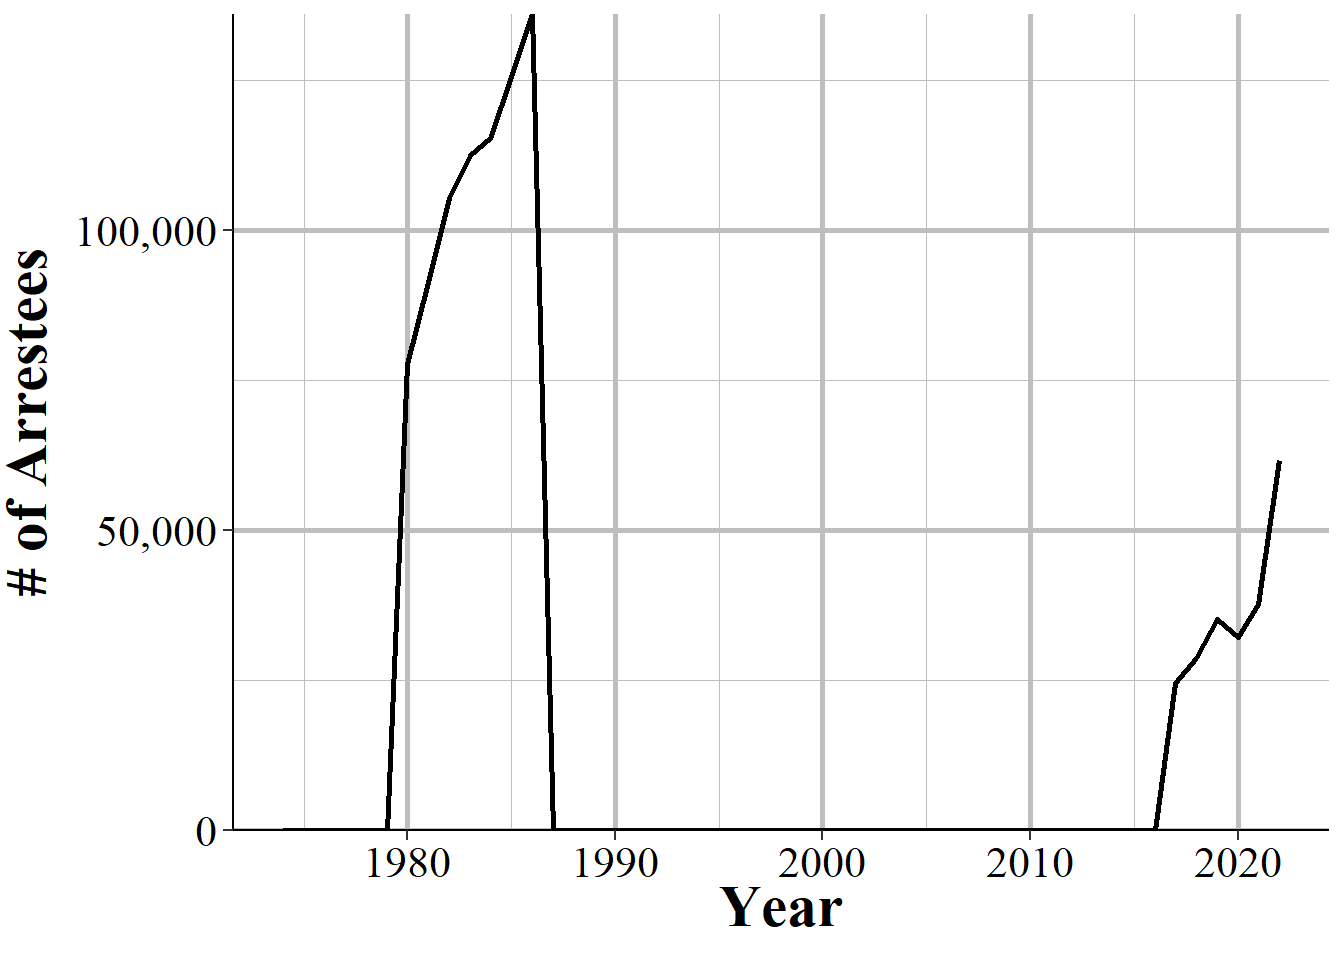
Figure 5.5: The national annual number of Hispanic arrestees for theft. This includes all agencies that year that reporting any number of months. Hispanic arrestees include both juvenile and adult arrestees
Perhaps a better way to look at this data is to see what percent of agencies report ethnicity data. Figure 5.6 show the percent of agencies each year that report at least one Hispanic or non-Hispanic (which are the only choices, but showing only Hispanic arrests would exclude agencies where no Hispanic people truly were arrested) arrest for theft. About 60% of agencies reported ethnicity data in the early 80s and then only a couple agencies report in 1990 and 1991. Other than those agencies, none report between 1987 and 2016. Starting in 2017, 36% of agencies report and this number has grown by about five percentage points a year until spiking to about 67% in 2021 and it remained steady in 2022. Given the fluctuations in reporting and how many years there is no data, I strongly recommend against using these variables, even for the recent years of data.
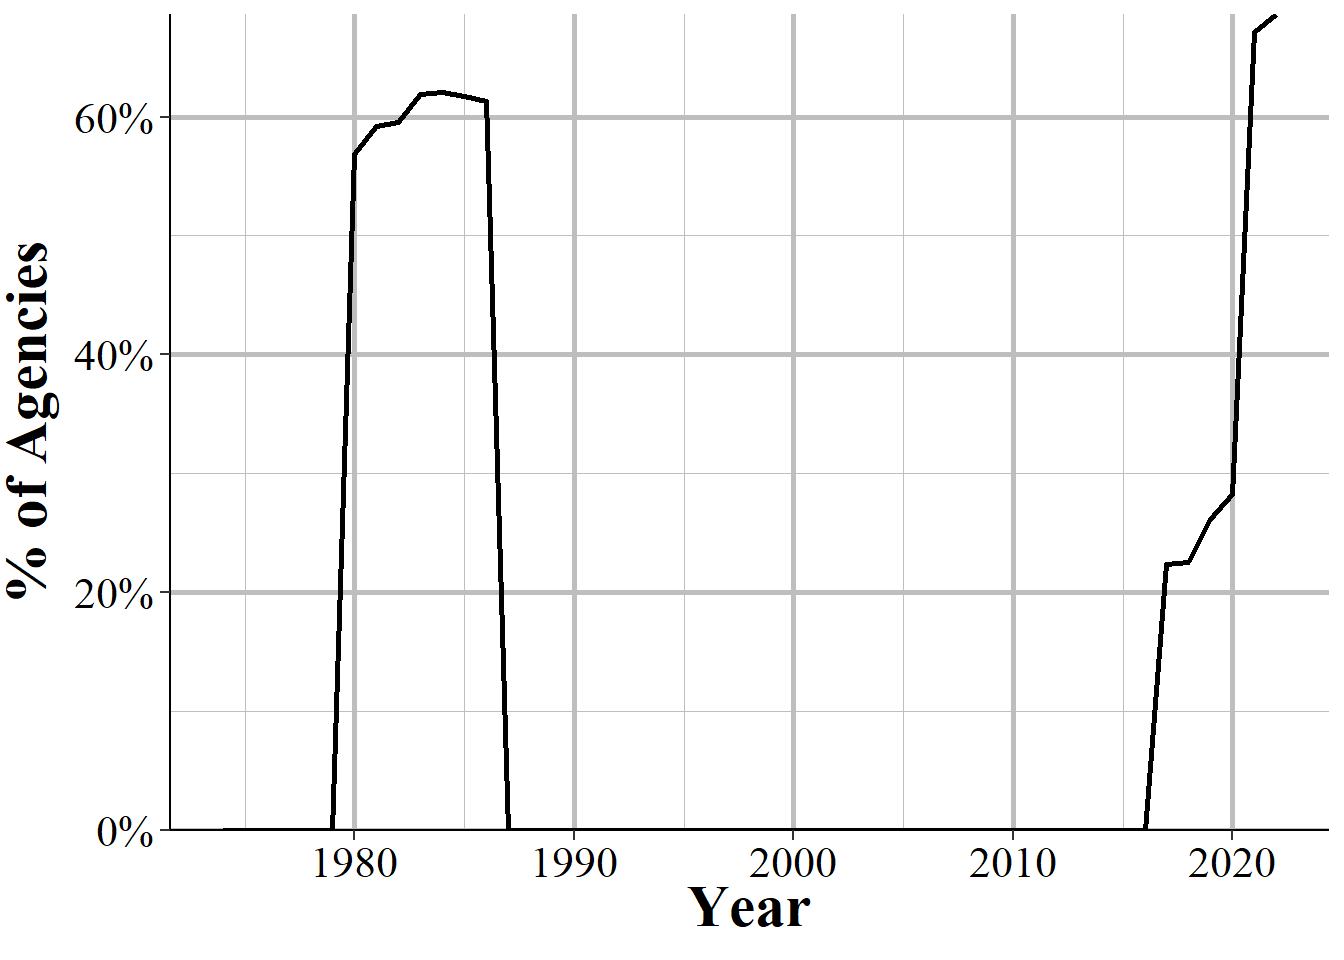
Figure 5.6: The annual percent of agencies that report theft arrests that reported at least one Hispanic person or one non-Hispanic person arrested for theft. Arrestees include both juvenile and adult arrestees.
5.3.4 Juvenile referrals
The final variable of interest are five mutually exclusive outcomes for juveniles who are arrested by the police for a crime that if they were adults would have been counted as a formal arrest. This variable is not available for data after 2020.
Unlike the rest of this data set where juvenile is defined as being under the age of 18, these variables allow states to use their own definition of juvenile. So potentially the limit for who is a juvenile could be below the age of 18, and nothing in the data indicates when this is so - you would have to check each state to see their definition and if it changed over time. There is no breakdown by crime so this gives you the outcomes for juveniles arrested for all crimes in that agency. Please note that the number of juveniles in other variables and the number here do not always line up, which is a mix of underreporting of this variable, arrests for other jurisdictions are not counted as an arrest in the above variables, and different age definitions for who is a juvenile. A juvenile may potentially get multiple referrals, such as being released and then later referred to court. But in this data only the initial referral is included. It is also unclear - and likely determined by a particular agency’s policy - what is reported when there are multiple initial referrals. Below are the five potential outcomes and definitions of each:
- Handled within department and released
- Juvenile is arrested but then released without any formal charges. Generally released to adult relatives with a warning but no formal charge.
- Referred to juvenile court or probation department
- Referred to welfare agency
- Referred to other police agency
- This includes when the agency makes an arrest on behalf of a different agency, such as when the juvenile committed a crime in that different agency’s jurisdiction. People arrested in this category are also not included in the other variables for juvenile arrests (e.g. arrests by age) as that only includes people who committed a crime in the agency’s own jurisdiction.
- Referred to criminal or adult court
- These are juveniles who are referred to be tried in criminal court as adults. This is for states that allow juveniles to be tried as adults. This is the police’s recommendation that they be tried as adults, regardless of the decision of the district attorney or court for whether that juvenile is ultimately tried as an adult.
We can look at an example of this in Figure 5.7 which shows the annual number of referral types in the entire United States from 1974-2023. For all the first couple of years almost all of the referrals have either been that the agency handles the arrest internally and releases the juvenile without any formal charges, or that the juvenile is formally arrested and referred to juvenile court. Since this only happens for a single year it appears to be a data issue.Starting in the late 1990s the number of referrals has declined over time, possibly due fewer juvenile arrests overall during this period.
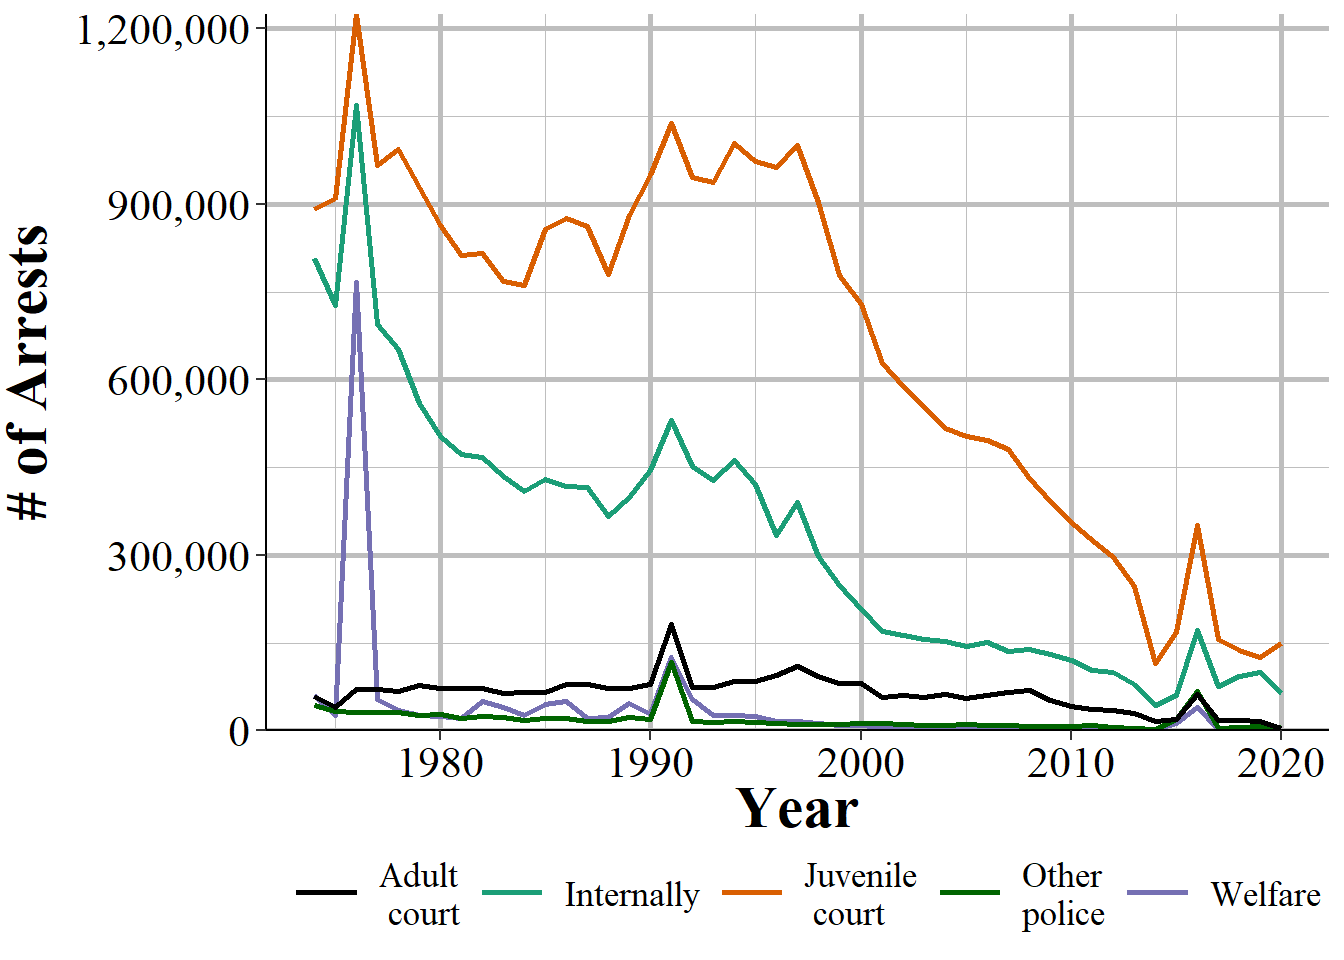
Figure 5.7: The annual number of juvenile referrals in the United States by referral type, 1974-2020.
In Figure 5.7 there is a massive spike in referrals to welfare, handled internally, and juvenile court cases in 1976 that occurs for a single year. Was this a year of superpredators? No, it was a year of Michigan data errors. In 1976 many agencies in Michigan provided erroneous data for this variable. This includes, for example, Washtenaw County Sheriff’s Office which had a population of 101,452 in 1976 and reported that 150,088 juvenile arrests were reported in welfare. Similarly, Otisville Police Department, population 760, had 10,000 referrals to welfare, and Saginaw Police Department, population 82,000, had 80,074 referrals to welfare, 27,213 referrals to juvenile court, and 6,230 juvenile arrests handled internally. When we remove Michigan, shown in Figure 5.8, this spike disappears.
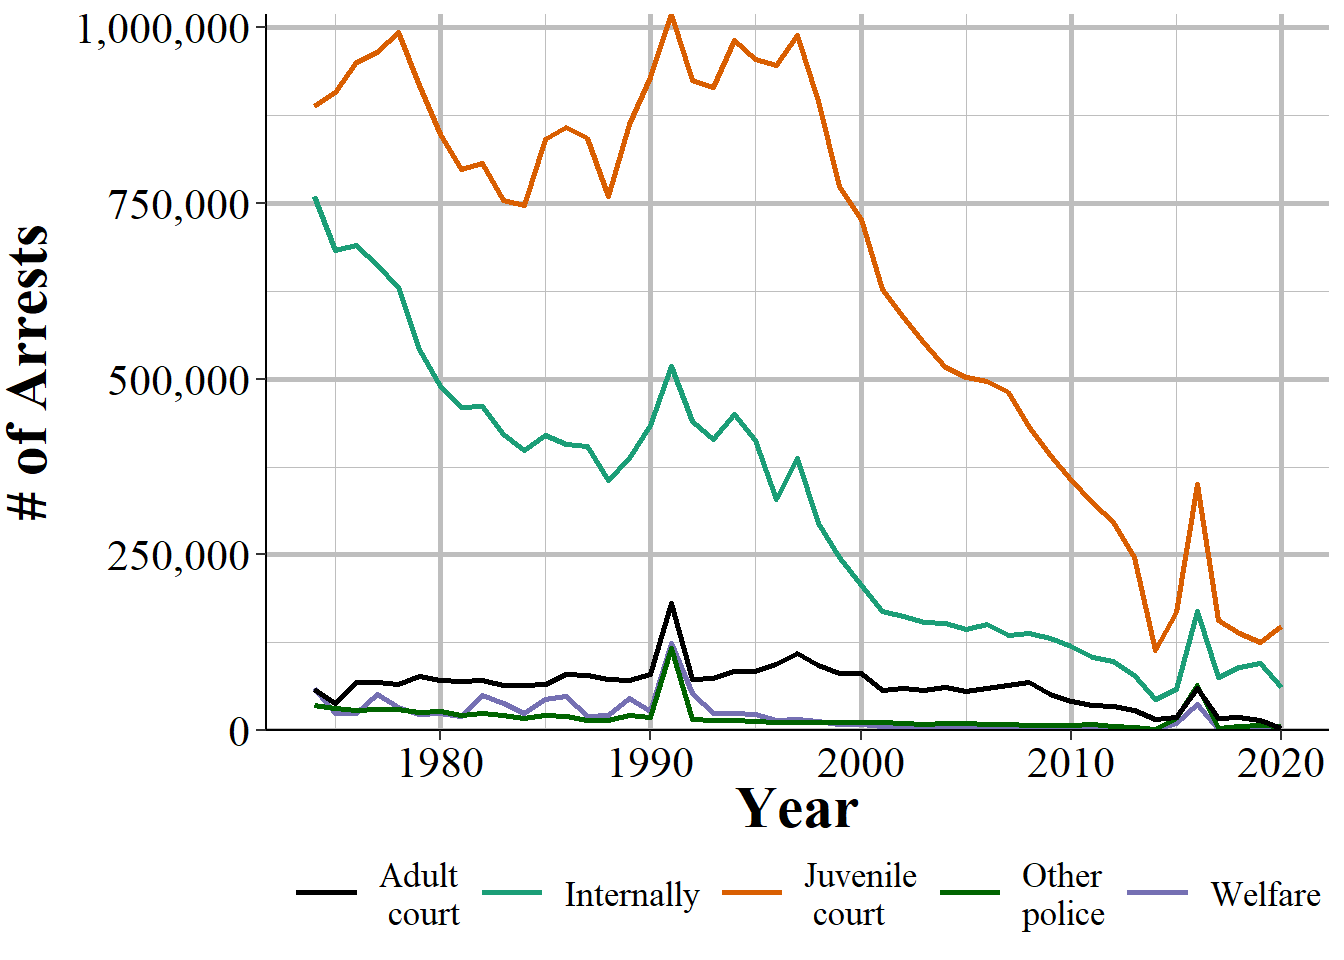
Figure 5.8: The annual number of juvenile referrals in the United States excluding agencies in Michigan by referral type, 1974-2020.
Michigan is unlikely to be the sole state with data issues in 1976, and 1976 is unlikely to be the only year with problems. We can see other spikes in the data such as small ones in 1991 and 2016. I leave the task of discovering the cause of these spikes to the reader.
Sometimes called Arrests by Age, Sex, Race, and Ethnicity.↩︎
Post-2020 years do have considerably fewer agencies reporting than in previous years.↩︎
Disparity, of course, does not even mean discrimination.↩︎
This is a simplification as there are other things that affect arrests such as witness cooperation, details of the offense like time of day and location, and (especially in the case of rare events like only 10 arrests) random chance.↩︎
Partly based on the quality of the data available as they considered these crimes to be a good combination of well-reported and serious.↩︎
This here is another example of where the “Uniform” part of Uniform Crime Reporting is more of a suggestion than a rule.↩︎
In my experience working directly with police data where I can identify a person arrested multiple times in about 5-10% of cases they have at least one arrest where their reported race is different than other arrests. Such as a person arrested five times and being reported as White four times and Black once. This is probably a mix of officers perceiving people differently (e.g. mixed race people) and having different officers report different race for the same person, and human error when entering data. But all of it suggests that there is at least some uncertainty in this variable.↩︎
Theft is used as it is one of the most common crimes.↩︎