Chapter 8 Arson
The arson data set provides monthly counts of reported arson incidents, with detailed breakdowns by type (e.g., arson of residential properties, vehicles, or public buildings) and the estimated value of property damage. The data spans from 1979 to the present and includes additional information on arrests, clearances, and unfounded cases.
This data includes all arsons reported to the police or otherwise known to the police such as when an officer discovers it while on patrol. It also has a count of arsons that lead to an arrest (of at least one person who committed the arson) and of reports that turned out to not be arsons, such as if an investigation found that the fire was started accidentally. This is essentially the Offenses Known and Clearances by Arrest data, detailed in Chapter 3, but for arsons. The data even follows the same definitions for categories such as what counts as a cleared or unfounded crime. The primary additional variable is the estimated damage in dollars caused by the arson. As much of this information is the same as detailed in Chapter 3, this chapter will be brief. If you have a question about definitions, please refer to that chapter.
The data set includes a variable indicating whether the arson occurred in an uninhabited structure, which refers to buildings that are vacant, abandoned, or not in regular use. This allows for estimates of how many building arsons had the potential to harm people, distinguishing between, for example, a vacant warehouse and a home where people could be harmed.
In cases where the arson led to a death, that death would be recorded as a murder on the Offenses Known and Clearances by Arrest data set - but not indicated anywhere on this data set. If an individual who responds to the arson dies because of it, such as a police officer or a firefighter, this is not considered a homicide (though the officer death is still included in the Law Enforcement Officers Killed and Assaulted data) unless the arsonist intended to cause their deaths.
8.1 Agencies reporting
This data set measures how many months that an agency reports data over a year in the same way as the Offenses Known data does: the standard FBI definition using the last month reported, and my own measure counting how many months reported data according to a column for each month that says so.59 And just like the Offenses Known data, the variable I use for my own measurement changed in 2018, leading to fewer months of data reported and making it non-comparable to pre-2018 data. The variable changed again in 2021 and said that all agencies always reported data in every month, making the variable useless.
In Figure 8.1 we can see the annual number of agencies that reported at least one month of data using both measures. These measures are nearly identical every year with the last month reported having slightly more agencies reported, but they are effectively the same. This changes in 2018 as my measure declines considerably and then skyrockets to nearly 25,000 agencies in 2021 and 2022. The last month reported variable declines considerably in 2021, consistent with the FBI ending SRS collection, and then rebounds in 2022 when the FBI reopens SRS collection. How can there be more than 18k agencies reporting? The 18k number is the estimated number of agencies that are active: agencies that can respond to crimes and do investigations. Remember that SRS data goes back decades - the Offenses Known data is available since 1930. So agencies can come and go, with agencies shutting down or joining with other agencies. Over time this adds up to thousands of agencies other than the 18k we normal think about.
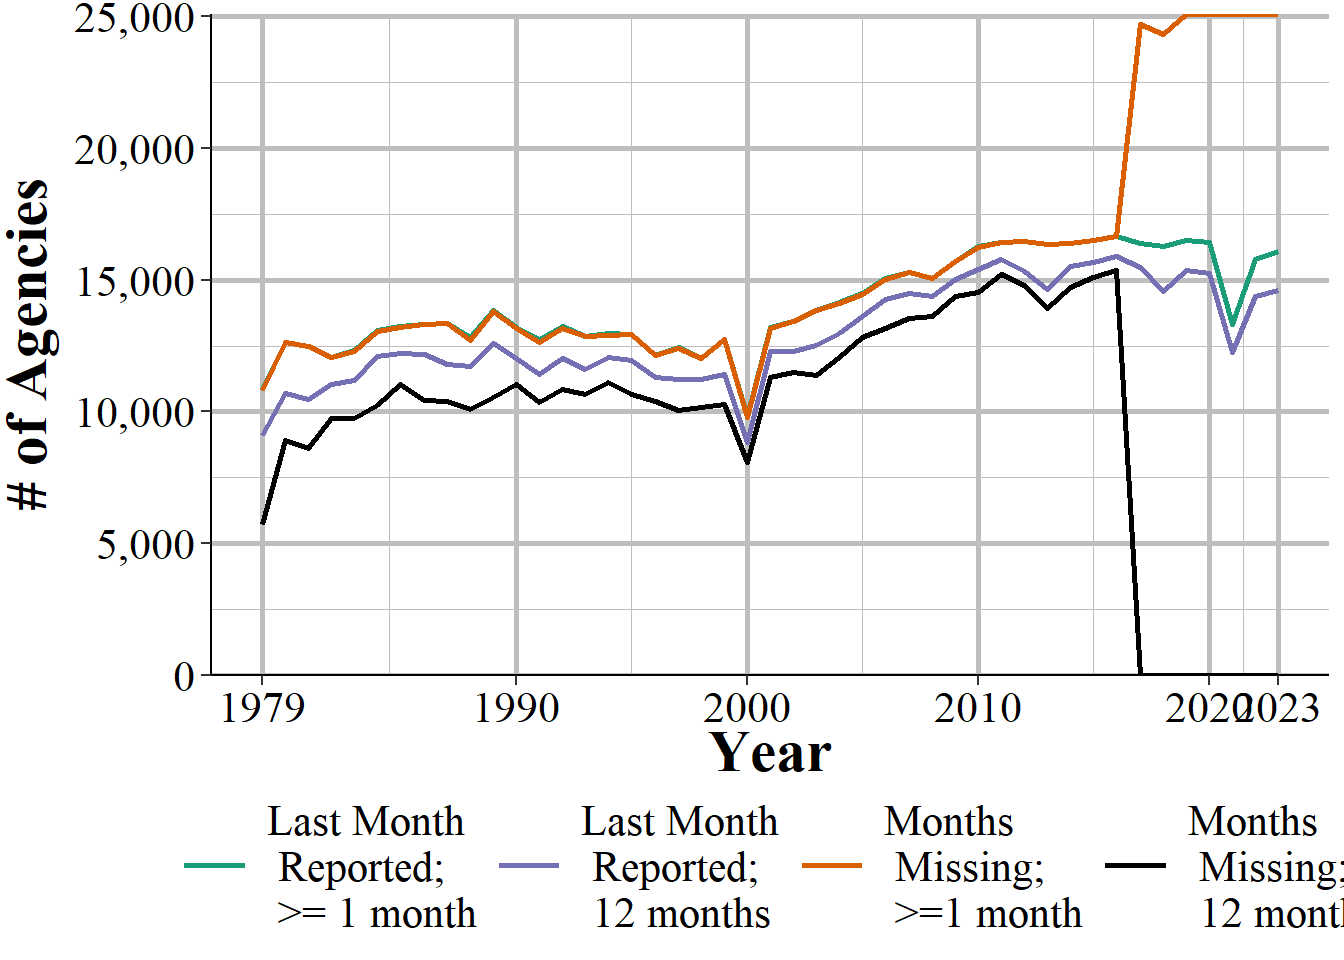
Figure 8.1: The annual number of police agencies that report at least month of data and all 12 months of data, using both measures of how many months are reported, 1979-2023.
8.2 Important variables
Similar to the Offenses Known and Clearances by Arrest data, this data shows the monthly number of crimes - in this case only arsons - reported or discovered by the police, the number found by police to be unfounded, and the number cleared by the police. In addition, it includes the number of arsons in structures that were uninhabited, and the estimated cost of the damage caused by the arsons. For each variable, the arsons are also broken into several categories of arsons, which we will talk about in Section 8.2.1. As with other SRS data sets, there are also variables that provide information about the agency - ORI codes, population under jurisdiction - the month and year that the data covers, and how many months reported data. When another agency submits data for the given agency, that is noted in the data through the “covered_by_ori” variable.
8.2.1 Types of arsons
For each of the outcome categories detailed below, this data set has information for ten different types of arson. Arsons are categorized into three main groups: building arsons, vehicle arsons, and other arsons (e.g., fires in outdoor areas like parks or forests). Building arsons are further subdivided into seven types, such as single-family homes, industrial buildings, and public structures. For each of the building arsons we also have variables that say how many of the arsons were of uninhabited buildings. Vehicle arsons are split between motor vehicles and other mobile objects, such as boats or airplanes.
- Total structures (buildings)
- Single occupancy (e.g. single family homes)
- Other residential (e.g. hotel, apartment)
- Storage (warehouses, storage facilities)
- Industrial
- Other commercial (e.g. restaurant, office building, car dealership)
- Community/public (e.g. government buildings, hospitals, community centers, places of worship)
- All other structures (all buildings that do not fit in another category’)
- Total mobile vehicles (vehicles)
- Motor vehicles (a car that runs on a road such as a SUV, sedan, motorcycle)
- Other mobile vehicles (other mobile objects such as airplanes and boats)
- Other (everything that does not fit in a previous category)
- Grand total (all arsons of any category)
Some arsons can burn down multiple types or structures or cars - fire, after all, tends to spread. This data defines the arson based on where the fire originated, regardless of what burns after that. This is true even if the damage is more severe for a type other than where the fire started. For example, a recent fire in California was started by a man “pushing a burning car into a ravine.” That fire, known as the Park Fire has burned over 429,000 acres and over 700 buildings. This fire would be classified as a motor vehicle arson because the fire started in a vehicle.
8.2.2 Actual arsons
This variable includes the number of arsons either reported to the police or otherwise known to the police in that month and that the police determine to actually be arsons - that is, reports that are not unfounded. This is the number of arsons, regardless of their severity. An arson that burns down a single vehicle is treated as one arson, as is an arson that burns down a vehicle, 429 thousand acres of land, and 600 buildings.
8.2.3 Unfounded arsons
This variable shows the number of arsons reports that the police determined to not actually be arsons. For example, if a house burns down and police think it was arson but later determine that it was an accident, it would be an unfounded arson. Whether an arson is unfounded is based only on the police’s determination about that event, not the decision of other groups like a court or the conviction of someone for the crime. However, this doesn’t mean that the officer makes that decision in a vacuum as they can use evidence such as the findings from firefighters for if the fire was an arson.
8.2.4 Reported arsons
This variable is the sum of actual arsons and unfounded arsons - it is the total number of arsons that were reported or known to the police, even if a later investigation found that it was not actually an arson.
8.2.5 Cleared arsons
This shows the number of arsons where at least one offender is arrested or when an arrest cannot be made for some reason, but the police know who the offender is - the latter option is called “exceptional clearances” or “clearances by exceptional means.” There is no way to tell if a clearance is due to an arrest or due to exceptional means.60
Please note that this data is at the incident-level which means that having multiple people arrested for an incident still only is a clearance for that single incident. If there are multiple people who committed the arson only one needs to be arrested or exceptionally cleared for the incident to be cleared.
Clearances are reported in the month they occur, which may be different than the month when the arson happened. This can create the illusion that more crimes are solved than were reported in certain time periods. Figure 8.2, for example, shows the number of actual arsons (reports that are founded) and clearances for single-family home arsons in League City, Texas, a city of about 100,000 outside of Houston. In most years there were fewer clearances than arsons, but in four years (1982, 1981, 1992, and 2007) there were more clearances than arsons.
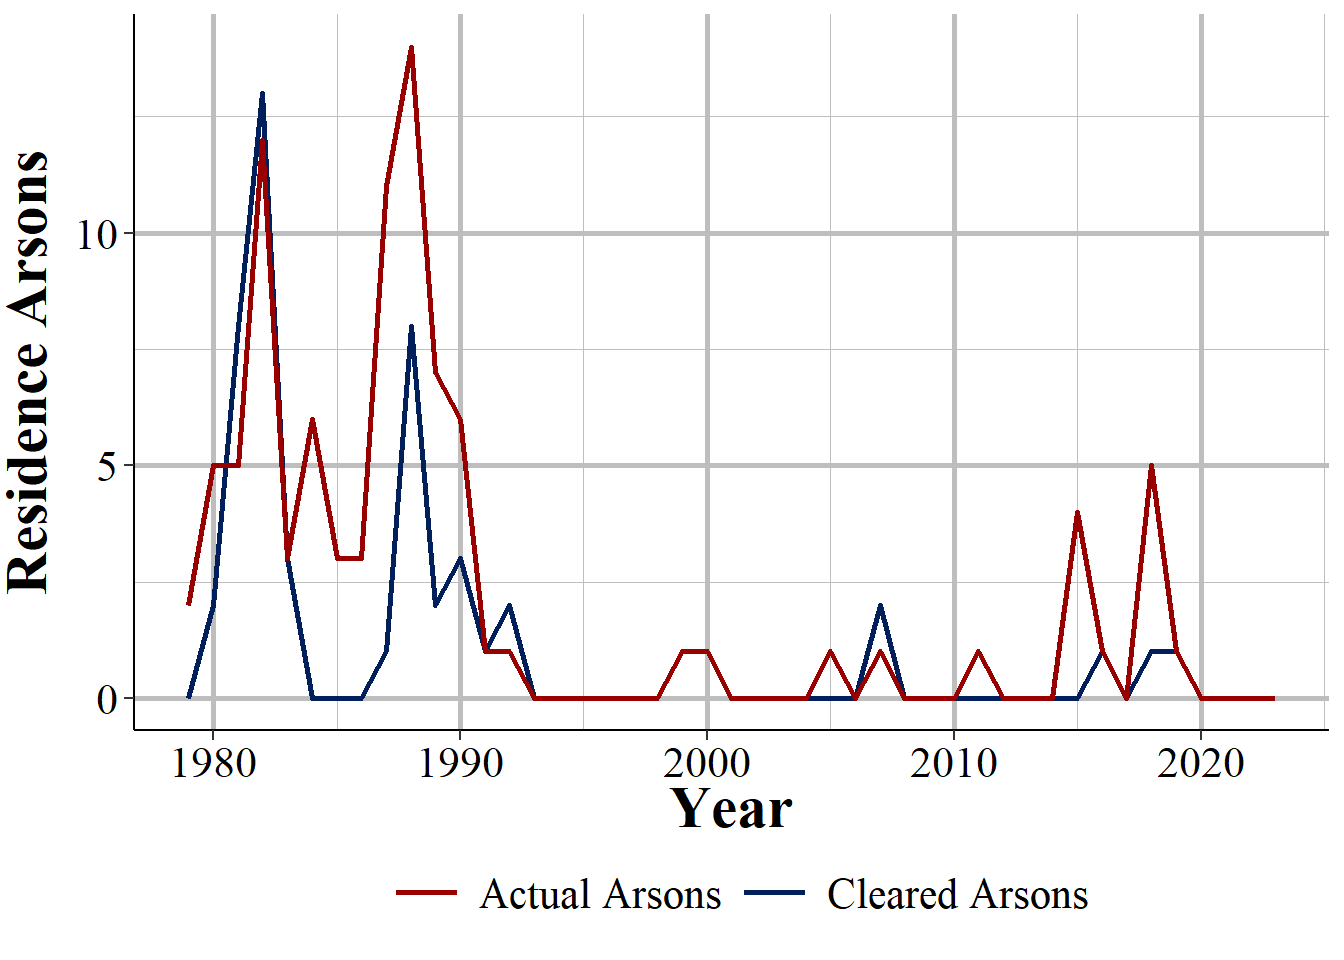
Figure 8.2: The annual number of single-family home arsons and clearances in League City, Texas, 1979-2023.
8.2.6 Cleared for arsons where all offenders are under age 18
This variable is the same for normal clearances but only for arsons where every offender is under the age of 18. For juvenile offenders, a clearance can still occur if the juvenile is issued a citation to appear in court, even if they are not formally arrested and taken into custody. As this variable requires that the police know the identity of every offender (to be able to determine that they are all under 18), it is likely flawed and merits caution when using.
8.2.7 Uninhabited building arsons
This data also includes the number of arsons that occur in uninhabited structures. These structures must be uninhabited in the long-term, not simply having no one inside them when the arson occurs. In the FBI’s manual for this data they define uninhabited buildings as ones that are “uninhabited, abandoned, deserted, or not normally in use” at the time of the arson. For example, a vacation home whose owners are not living in at the time would be “not normally in use” so would be an uninhabited building. A business that is closed when the fire started, but is open during the day, is not an uninhabited building.
8.2.8 Estimated damage cost
The final variable is the estimated cost of the arson. This is how much the police estimates the value (in dollars) of the damaged or destroyed property is. Since this is the value of property damage, injuries to people (including non-physical injuries such as trauma or mental health costs) are not included. Since this is estimated damage it may be inaccurate to some degree. This variable is the sum of monthly estimated cost so while you can get the average cost by dividing this by the number of actual offenses, this average may be significantly off due to having extremely small or large values in your data. This value may be $0 since arsons include attempted arsons which may cause little or no damage. Please note that this value is not inflation-adjusted so you will have to adjust the value yourself.
8.3 Data errors
As with other SRS data sets, the arson data sometimes includes clear data entry errors, such as reporting implausibly high numbers of arsons for small jurisdictions or recording unrealistic damage estimates. For example, Figure 8.3 shows the annual number of single-family home arsons in Byron City, Illinois, which has a population of slightly over 3,600 people. In every year there are zero arsons reported until 2003 when 469 arsons are reported. Since it is exceedingly unlikely that suddenly an eighth of the city each suffered different arson attacks, and that the city never again had a residence arson, this is almost certainly a data entry error. As arsons are relatively rare, having errors - and especially ones like this - can drastically change the results of your analysis so it is important to check your data carefully for more errors.
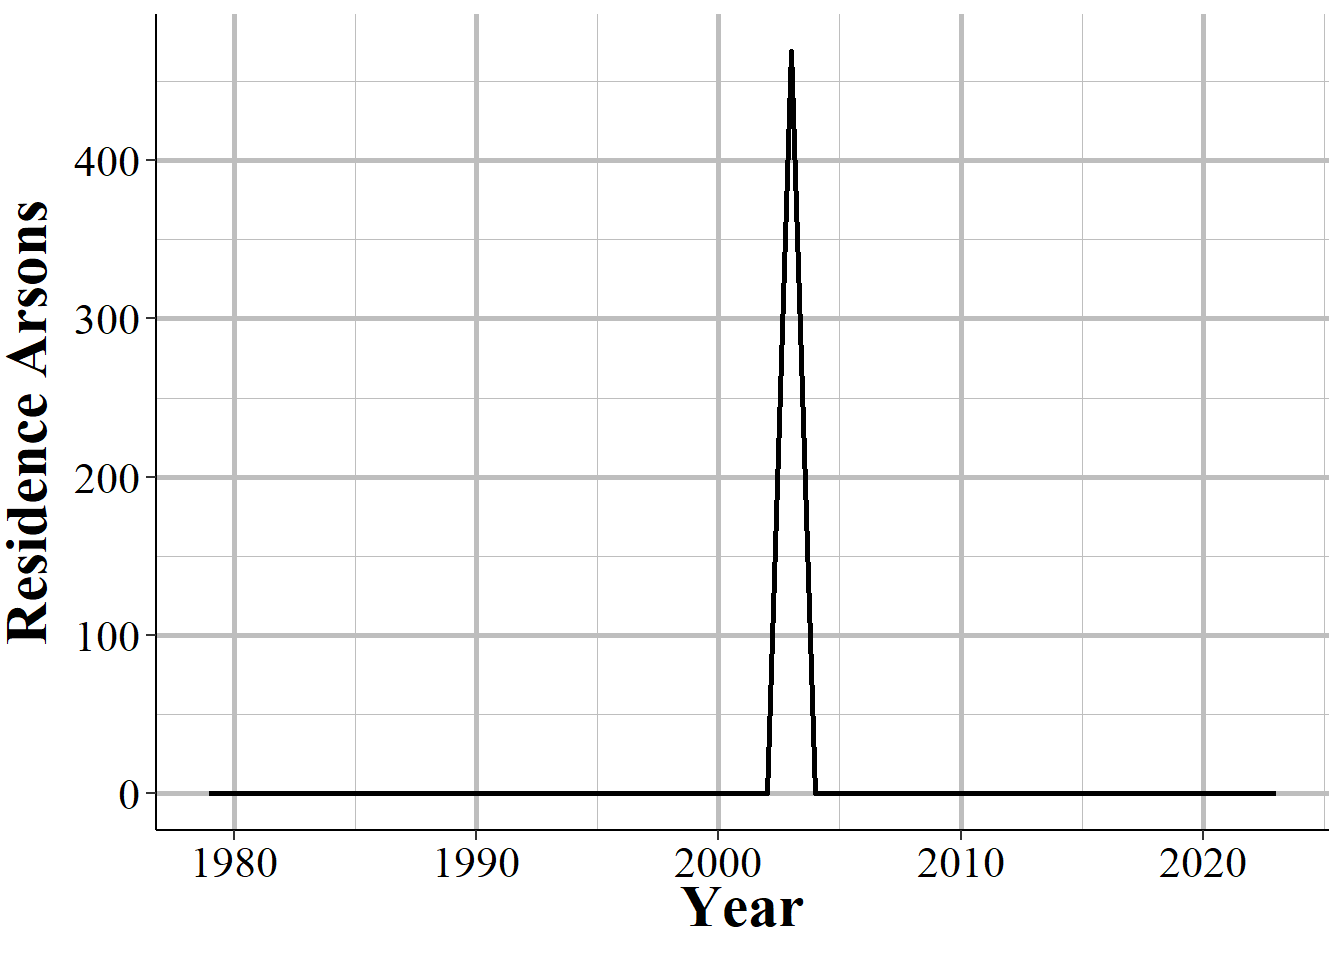
Figure 8.3: Annual single-family home arsons in Byron City, Illinois. The sudden spike to over 400 arsons in a single year is an example of data errors in this data set, 1979-2023.
There are also cases where it is less clear when a value is a data error or is simply due to an outlier - but real - value. For example, Figure 8.4 shows the annual average cost of a single-family home fire in Los Angeles, California. In most years the value is low. Since an arson can cause little or no damage, these low values likely mean that on average only part of the house was damaged, rather than the entire house burning down. In 2009, however, the average damage is about $540,000 per arson. Is this a data entry error that simply inputs a damage value that is too high? It certainly appears to be a data error since it is a sudden huge jump in damage value. However, it could also be that some extraordinarily expensive homes were destroyed that year. In 2009, Los Angeles reported only 63 single-family home arsons so having one, or a few, super mansions - which LA has plenty of - destroyed could mean that this huge value is real.
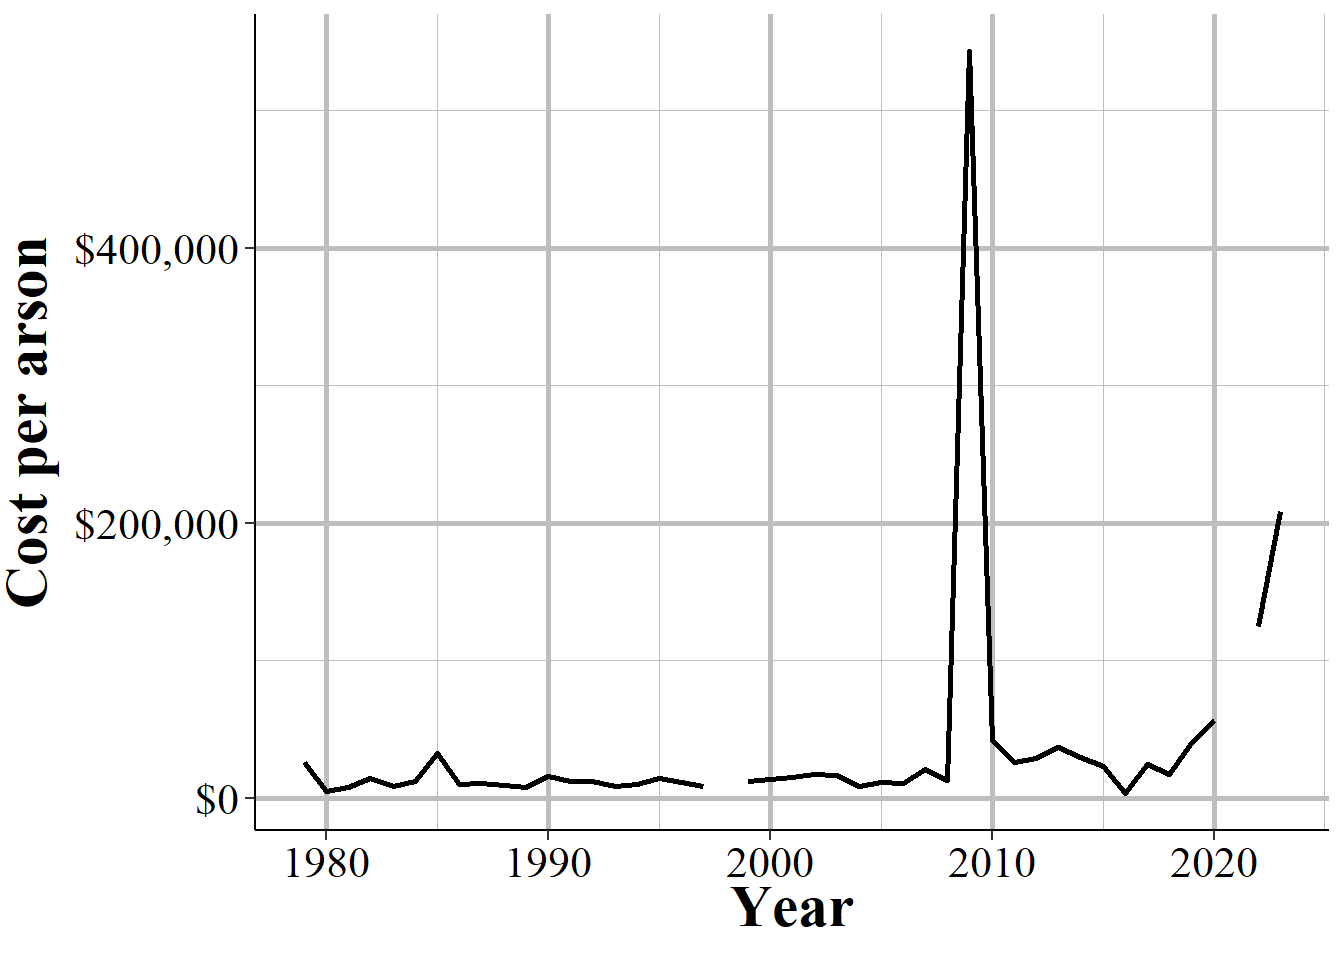
Figure 8.4: The annual cost per arson for single family homes in Los Angeles, California, 1979-2023.