Chapter 7 Law Enforcement Officers Killed and Assaulted (LEOKA)
The Law Enforcement Officers Killed and Assaulted data (sometimes referred to as the “Police Employees” data set), often called just by its acronym LEOKA (“LEE-OH-KUH”), has two main purposes. First, it provides counts of employees employed by each agency - broken down by if they are civilian employees or sworn officers, and also broken down by sex (male and female are the only options). And second, it measures how many officers were assaulted or killed (including officers who die accidentally such as in a car crash) in a given month. The assault data is also broken down into shift type (e.g. alone, with a partner, on foot, in a car, etc.), the offender’s weapon, and type of call they are responding to (e.g. robbery, disturbance, traffic stop). The killed data simply says how many officers are killed feloniously (i.e. murdered) or died accidentally (e.g. car crash) in a given month. The employee information is at the year-level so you know, for example, how many male police officers were employed in a given year at an agency, but do not know any more than that such as if the number employed changed over the year. This data set is commonly used as a measure of police employees and is a generally reliable measure of how many police are employed by a police agency. The second part of this data, measuring assaults and deaths, is more flawed with missing data issues and data error issues (e.g. more officers killed than employed in an agency).
7.1 Agencies reporting
Figure 7.1 shows the annual number of police agencies that reported at least one month that year. The first year of data available, 1960, has about 8,400 agencies reporting though this quickly drops to a trough of around 4,800 agencies that last for several years. After some undulations in the 1970s, reporting agencies steadily increases to nearly 14,000 agencies in the 1980s and remains steady until declining to around 12,000 by the late 1990s. Then reporting again steadily increases through 2020 to about 16,000 agencies by the end. 2021 has a massive drop in reporting to only about 5,000 agencies and then slightly increasing in 2022.53
The decline after 2020 is part of what I have referred to as the “death and rebirth” of the SRS. 2020 was the last year that the FBI accepted SRS data - though in 2022 they began accepting SRS submissions again. As noted in previous chapters, this death and rebirth led to changes in both which agencies reported and what data was reported. In 2021 when only NIBRS was collected, no SRS agencies could report, but even once they began to accept SRS data again the damage was done. Some agencies were transitioning from SRS to NIBRS so reported neither, while others likely made the decision to stick to NIBRS only - perhaps caused by their data vendor no longer supporting SRS data.
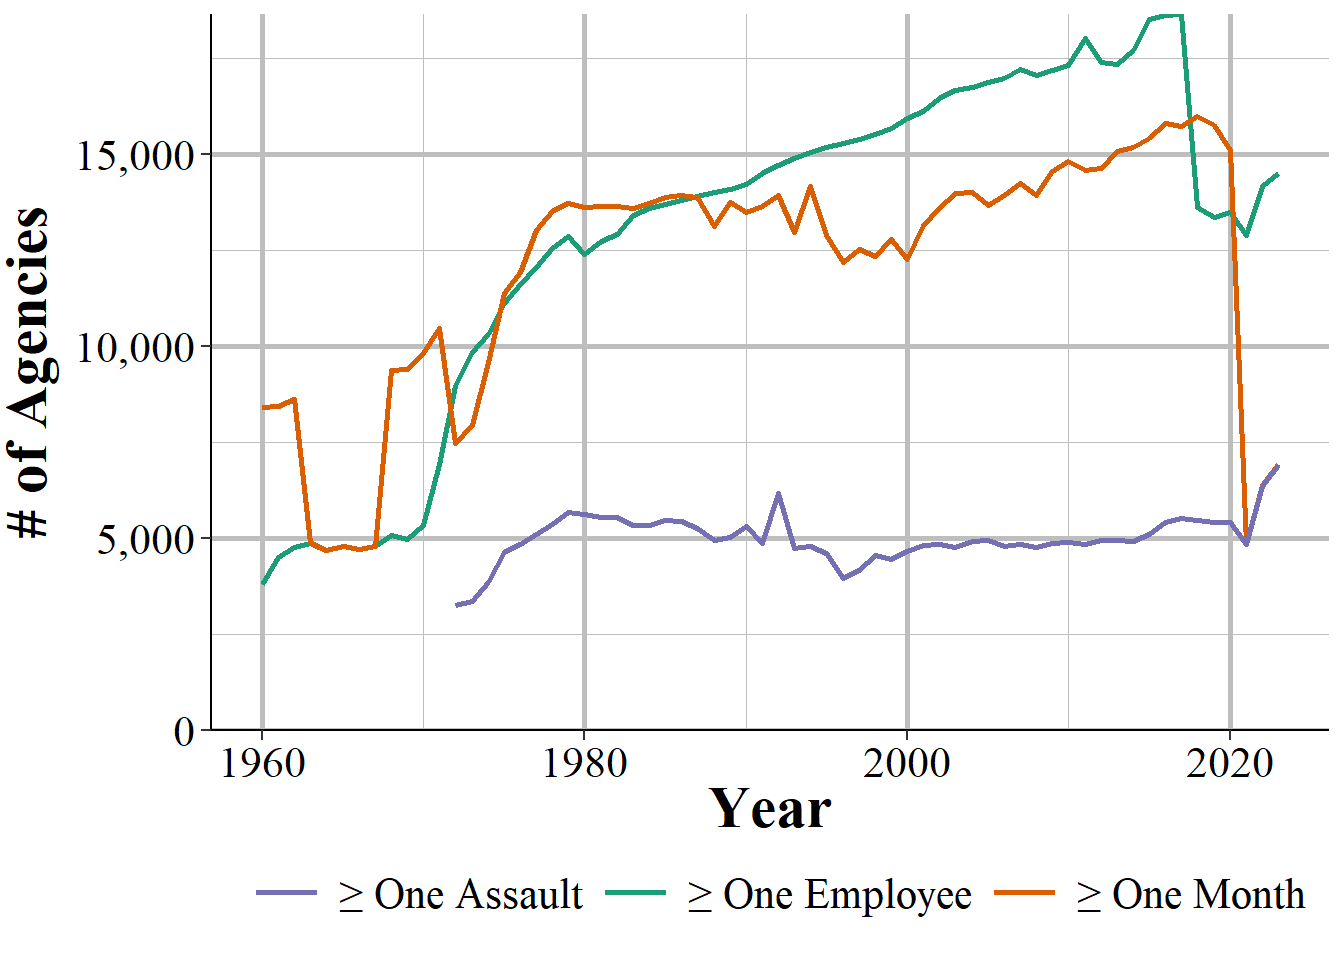
Figure 7.1: The annual number of police agencies that report at least month of data, at least one employee, and at least one assault against an officer, 1960-2023
Part of the decline we see in Figure 7.1 is because starting in 2018 - for reasons I am unsure of - many more agencies started reporting having zero employees. In Figure ?? we can see the annual number of agencies that report having at least one employee (civilian or sworn officer). Compared to Figure 7.1 we see more agencies reporting since the 200s, and an earlier but less steep drop in reporting.
I mentioned that LEOKA has two purposes: employee information and assaults on officers information. You should really think about this data as two separate data sets as agencies can report one, both, or neither part. In practice, more agencies report data on the number of employees they have than they do for assaults on officers. In Figure ?? we can see that in most years of data fewer than 6,000 (out of ~18k agencies in the country) report having at least one officer assaulted. The year with the most agencies reporting >1 assault was 2022 with 6,397 agencies. Most years average about 5,000 agencies reporting at least one assault on an officer. Though there is variation over time, the trend is much more settled than in the previous figures without any sharp decline in recent years. Assaults on officers is relatively rare, at least considering how many officer-civilian interactions occur. And many agencies are small with relatively little crime. So agencies that say they had zero assaults on officers may in fact truly have zero assaults. However, there are agencies that likely do have assaults on officers - such as large, high crime agencies which report assaults in other years - which report zero assaults in some months or years. So you will need to be careful when determining if a zero report is a true zero rather than an agency submitting incomplete data.
7.2 Important variables
The important variables can be divided into two sections: information on people employed by the department, and information about assaults against officers. The employee information is a snapshot in time during the year while the assault information tells you the number of assaults, broken down several different ways, for each month of the year. Like other UCR data, there are also variables that provide information about the agency - ORI codes, population under jurisdiction - the month and year that the data covers, and how many months reported data.
7.2.1 Number of employees
This data includes the number of people employed by the department with breakdowns by if they are civilian employees or sworn officers (i.e. carries a gun and badge and can make arrests) as well as by gender. The only genders available are female and male. This is the number of employees as of Halloween that year so it is a single point in time. Though this helps us as it is consistent every year, we do not know exactly when certain officer classes start, which we would likely see through a jump in employment that year, or if employment or hiring patterns change over the year.
- Officers
- Civilians
One of the claims made around the massive crime spike during Covid is that it was caused, at least in part, by an exodus of police officers. Fewer police officers led to more crime. Luckily, we can easily determine if there were fewer officers employed starting in 2020. In Figure 7.2 we have the total number of sworn officers and civilian employees in the country from 1960 through 2022. The number of both groups has fairly steadily increased since 1960 until plateuing around 2010 and then fairly sharply dropping in 2018 before rebounding a bit in 2022. So the number of employees dropped before 2020, actually increased a tiny bit in 20202 itself, and increased in 2022. Obviously all the claims about a declining number of officers was wrong.
Well, not quite. This country’s population has grown quite a bit since 1960 so we really want to do some kind of rate of officers per civilian population. And as we saw earlier not all agencies report data. So changes over time may really just be changes in which agencies report data. For a good comparison we need to look at only agencies that have reported data for every year we are interested in. And that is all assuming we actually care about national trends which we really should not. Crime is a local issue; what happens in your community - be it whether officers are leaving or crime is increasing - matters a whole lot more than what is happening across the country.54
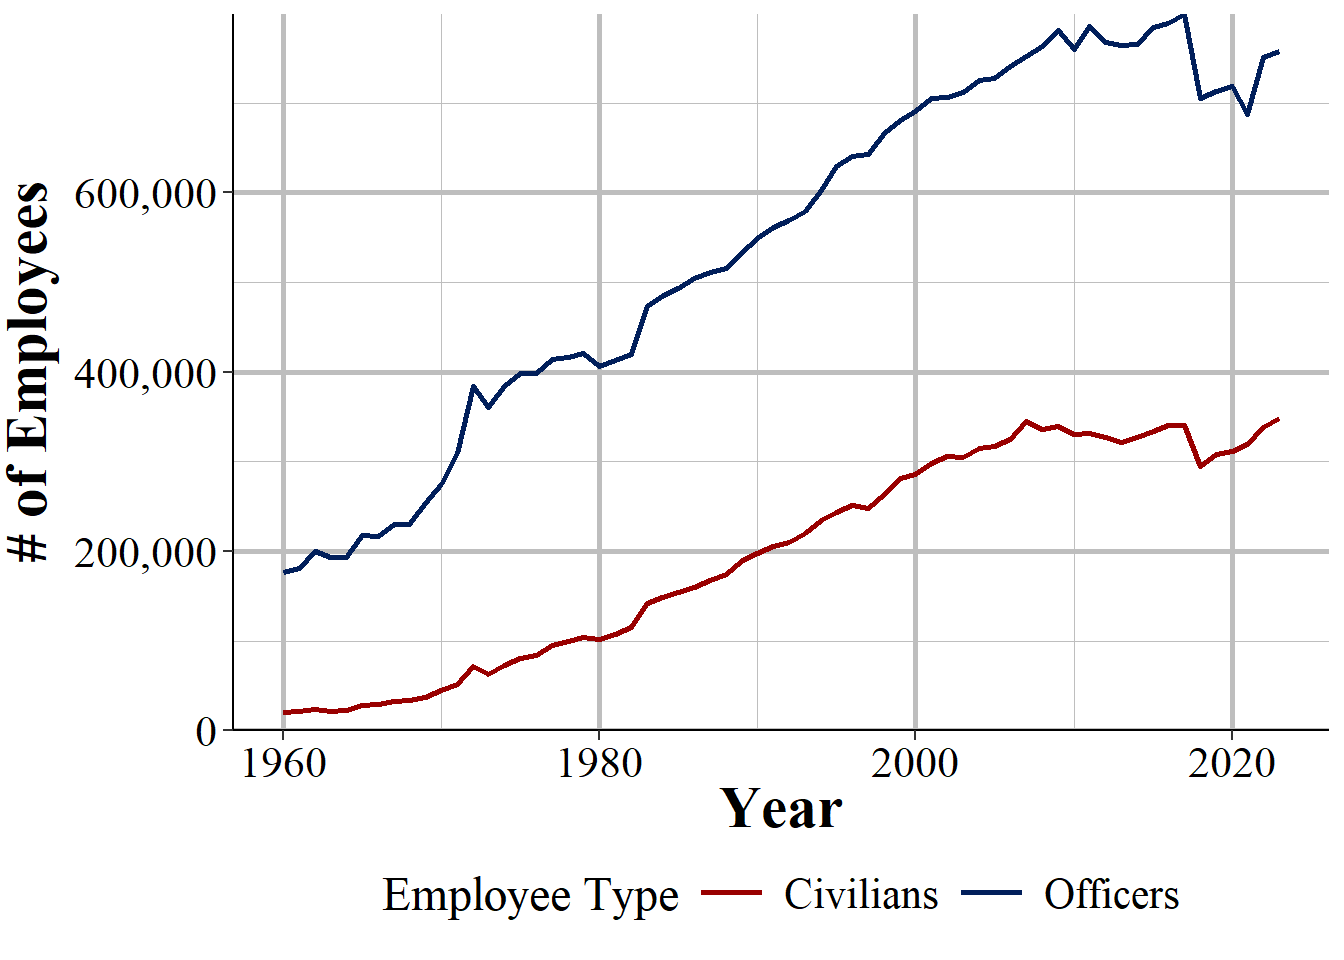
Figure 7.2: The number of civilian employees and sworn officers in the United States, 1960-2023
So now lets look at a local example: the Philadelphia Police Department as shown in Figure 7.3. The number of civilian employees has remained at a little under 1,000 employees from about 1970 through the end of our data, though declining very slightly since the middle 2000s. This is curious since the city’s population and crime trends have changed dramatically over this time and the ability of civilian employees to contribute has also changed, such as that they now have computers.55 In contrast, the number of police has changed far more than civilians, growing rapidly in the 1960s and 1970s to peaking at a little over 8,000 officers in the mid-1970s before declining substantially to the 6,000s. in the late-1980s. As with some larger agencies nationwide, the number of officers increased in the 1990s and then has decreased steadily in ensuing years. By recent years there are about as many officers as in the late-1980s, even though the city’s population has grown substantially since then. What stands out is that in 2020 there are zero sworn officers or civilians employees. By 2022 there are fewer sworn officers but more civilian employees than in 2020. 2021 is simply due to Philly reporting zero employees in that year, though obviously this is not actually a reflection of reality. When looking at only one city like we do here it is glaringly obvious that there is a data issue. The problem is that when looking at aggregate data, like we do in Figure 7.2 it is much harder, without additional data cleaning steps, to determine what is a data error and what is a true change.
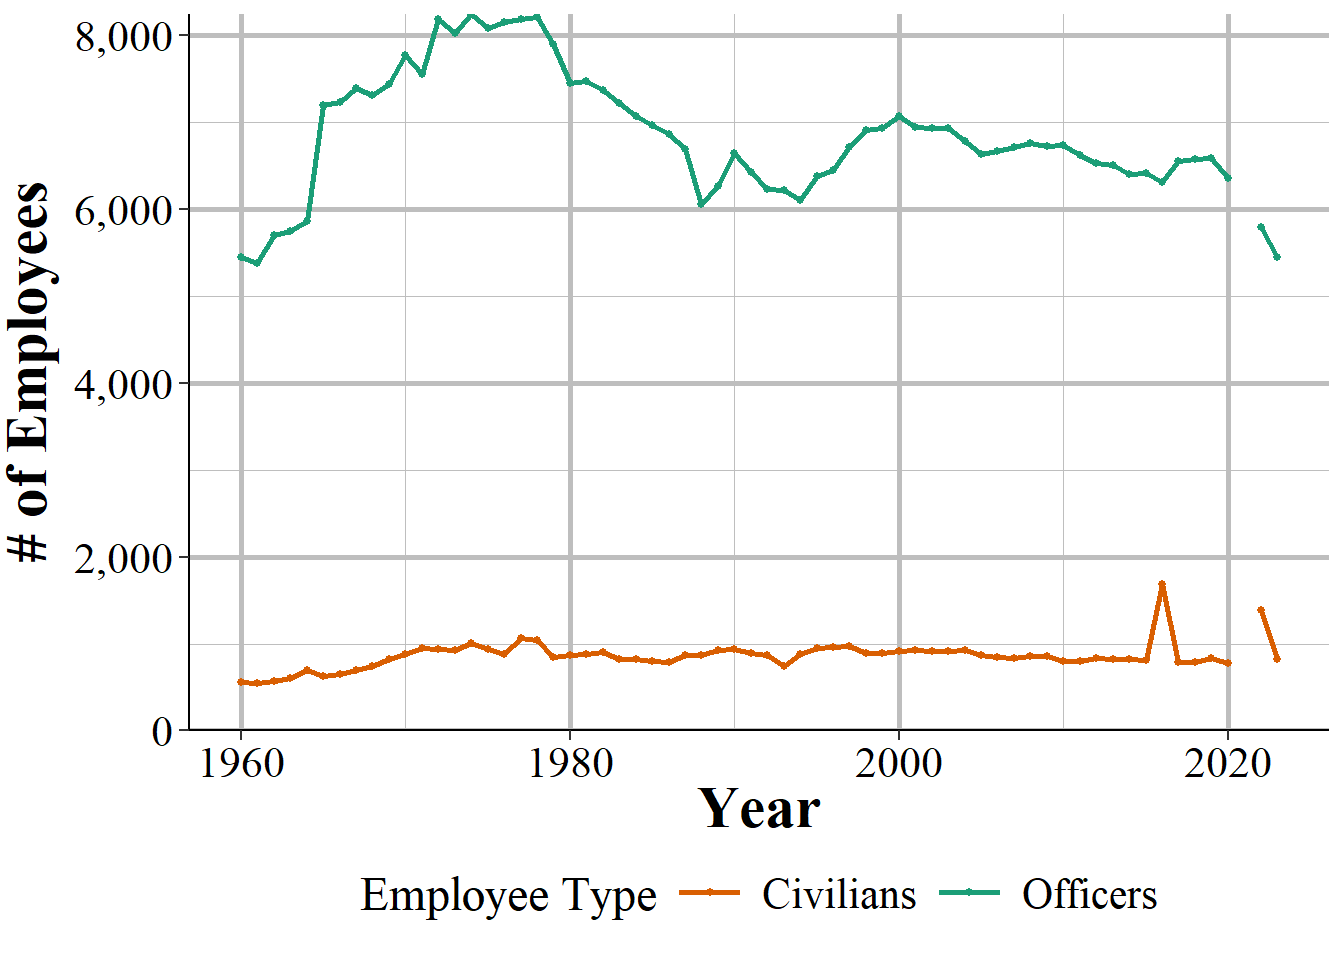
Figure 7.3: The number of civilian employees and sworn officers in the Philadelphia Police Department, 1960-2023
We can also look at the number of officers (or civilian employees) by gender. Figure 7.4 shows the percent of Philadelphia police officers by gender while Figure ?? shows the number of officers. For the first decade of data all female officers (or civilians) were recorded as male, so that variable should be interpreted as “total officers” until 1971 when it is split into gender. Starting at basically 0% of officers in 1971, female officers grew until they made up about a quarter of officers in 2000 and then has declined slowly since then.56
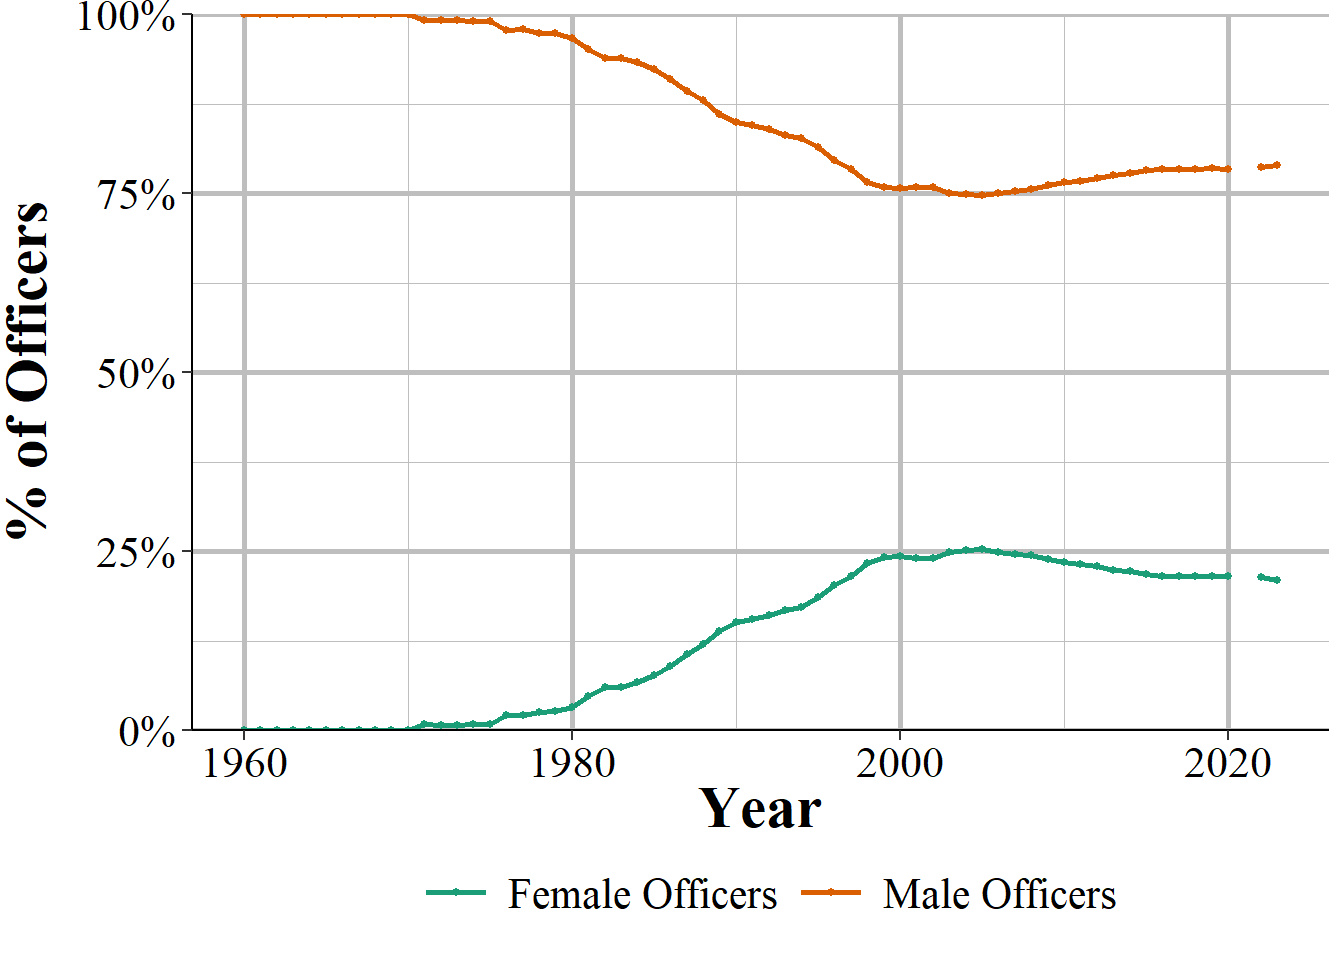
Figure 7.4: The percent of female and male sworn officers in Philadelphia, 1960-2023
7.2.2 Officers killed
There is almost no information about officers killed. The data only breaks this down into if they died “feloniously” which just means that someone killed them on purpose (e.g. shooting them, intentionally hitting them with a car) or if they died “accidentally” such as if they die during a car crash while on duty. The FBI actually collects more information on officer deaths than they release in this data. This includes the circumstances of each death such as the type of death (e.g. car crash, shooting, ambush, etc.), what weapon the offender had if feloniously killed, and even a detailed written summary of what occurred for each officer killed. They post this information in their annual LEOKA report which is part of their Crime in the United States report. The 2019 report, for example, can be found on their site here.
We can look at what data is available through Figure 7.5 which shows the number of Los Angeles Police Department officers killed over time. There are no accidental killings until 1975 though this is misleading because that accidental killings variable is not reported until 1971, which is a year in which many other variables in this data began reporting. So we actually have no idea how many officers were killed accidentally from 1960-1970 since this variable is always reported as 0. In general it seems like there is about one officer killed per year in recent decades while the period from 1980 to 2000 was the time of highest danger with as many as five officers killed in a single year. We can also see some trend changes with felonious killings more common than accidental killings in the 1990s and then accidental killings becoming far more common starting in 2000.
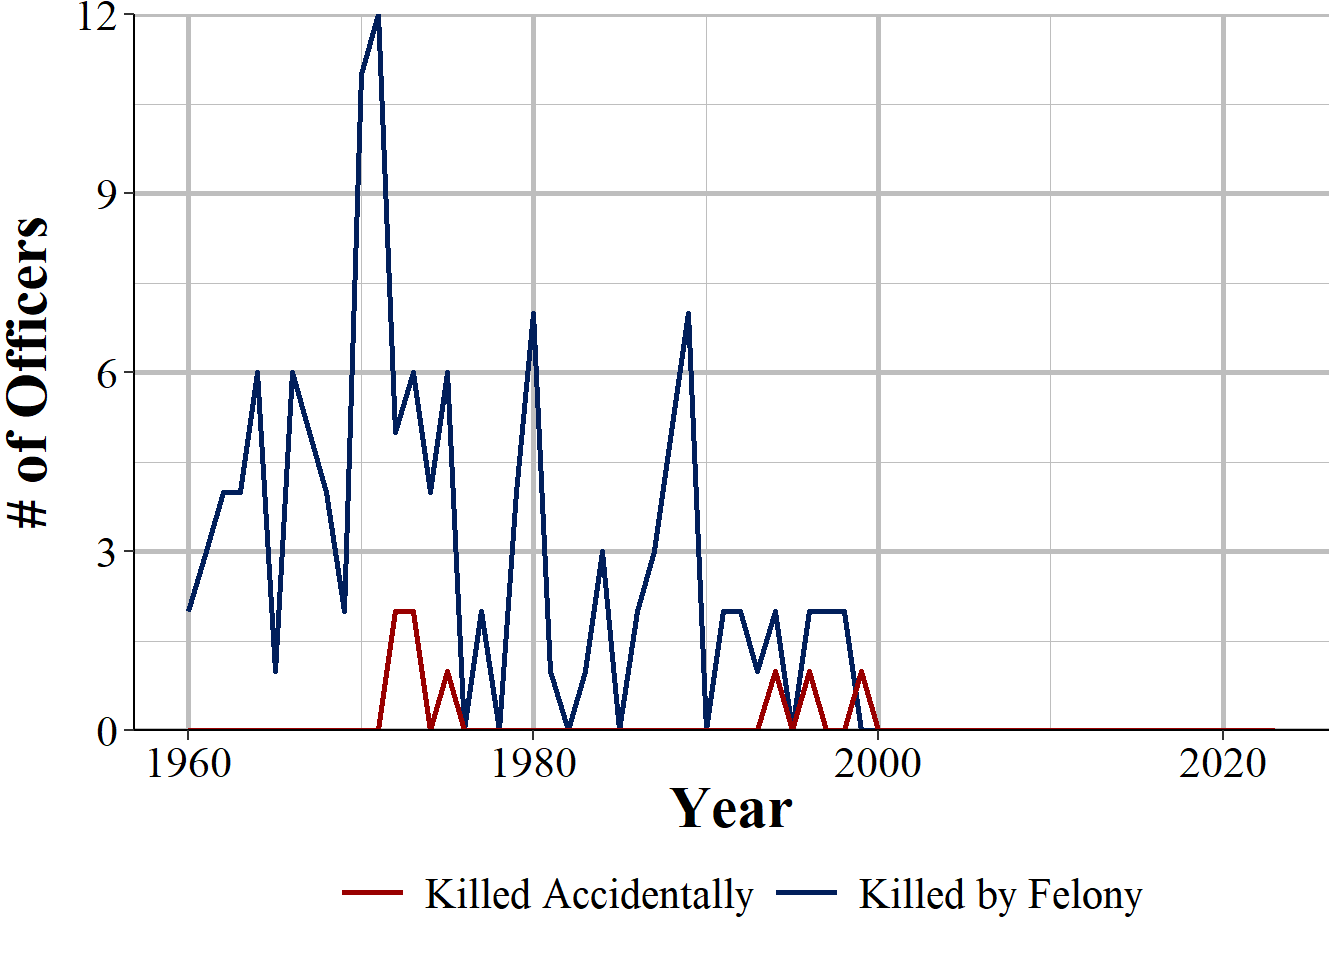
Figure 7.5: The number of officers killed by felony and killed accidentally in New York City, 1960-2023
We can also look at the national number of officers killed as shown in Figure 7.6. Please note that this is simply summing up the number of officers killed by all agencies that report that year so changes over time are certainly partially due to different agencies reporting each year. Therefore, we will focus on interpreting the different between felony and accidental killings rather than counts over time - though even this may be off if agencies that reported more felony or more accidental killings differ in their reporting over time. Again we see that there are no officers killed accidentally, due to that variable not being reported, until 1971. The difference between officers killed by felony and killed accidentally is widest are the start of our data and narrows considerable until there are only several more felonious killings than accidental killings by the late 1990s. This trend reverses in the early 2010s with accidental killings decreasing and felonious killings increasing again.
The last several years of data have extremely few officers killed accidentally, with fewer than 10 a year since 2018 and even zero officers killed in 2021. According to the website Officer Down Memorial Page, there were 719 officers who died in 2021, including some that should meet the killed accidentally criteria.57 For example, 23 officers were reported to have been killed by an automobile crash. So this data on officers killed is incorrect, is an undercount, and should be used only with a great deal of caution.
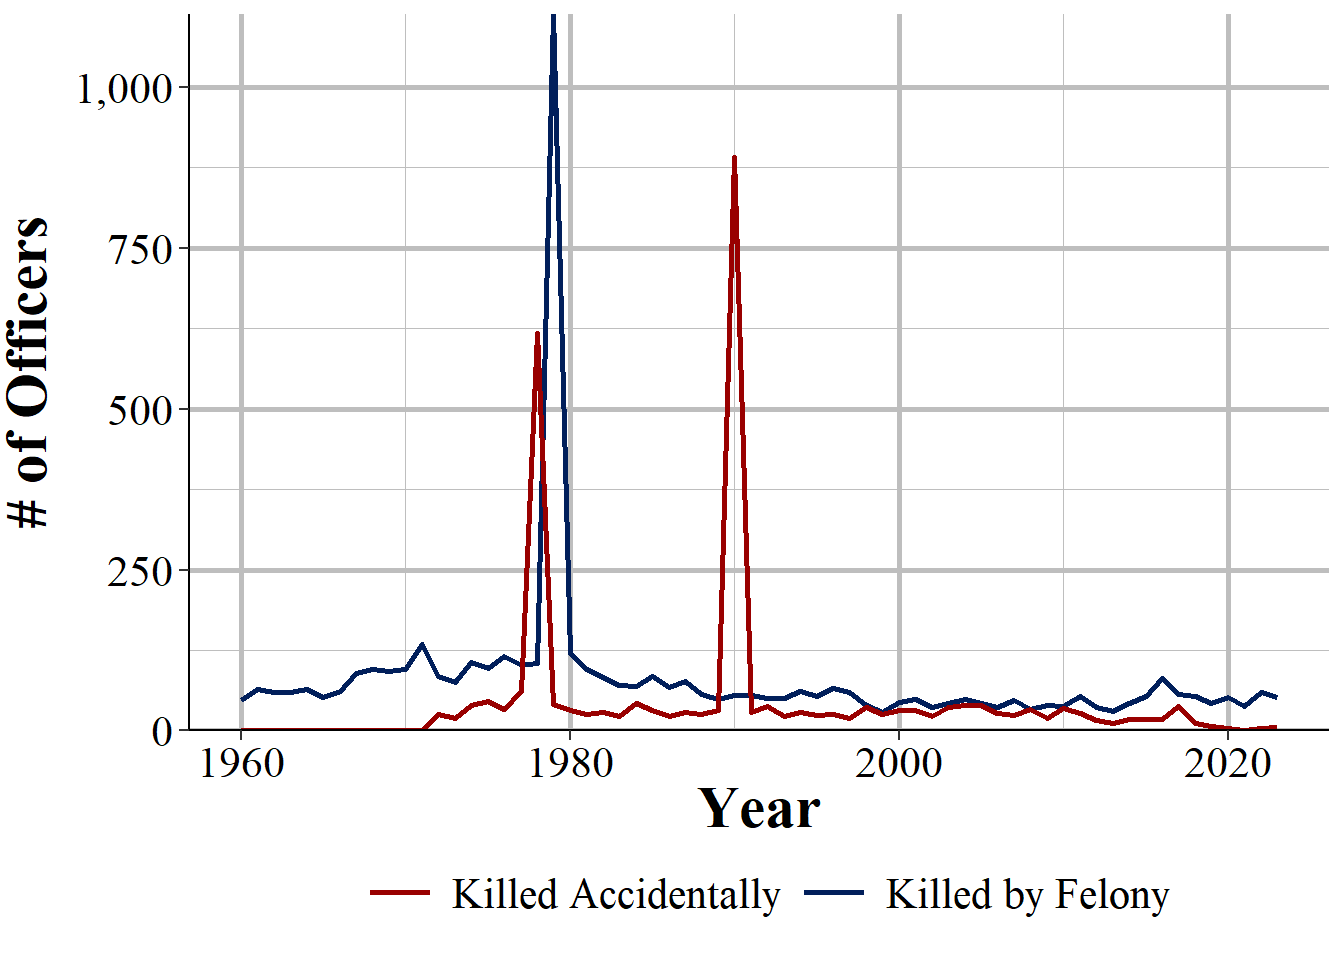
Figure 7.6: The national number of officers killed by felony and killed accidentally, 1960-2023
7.2.3 Assaults by injury and weapon
This data breaks down the monthly number of assaults on officers in a few different ways. Here, we will look at the number of assaults where the officer is injured or not injured and within these categories by which weapon the offender had. This is the number of officers assaulted so if an incident has three officers assaulted, that will count as three different assaults. If the offender used multiple weapons then only the most serious weapon would be counted. For example, if an offender used a knife and a gun during the assault, the assault would be counted as a gun assault. Unfortunately we only know if an officer was injured or not and not the severity of the injury. So we cannot tell if the officer is merely bruised or was shot or stabbed.
- Assaults with injury
- Offender has firearm
- Offender had knife
- Offender had other weapon
- Offender was unarmed
- Assaults without injury
- Offender has firearm
- Offender had knife
- Offender had other weapon
- Offender was unarmed
We can start by looking at the breakdown of assaults by injury and weapon type for officers in the Los Angeles Police Department. Figure 7.7 shows the number of assaults from all years reported for these categories. Over the complete time period there were almost 43,000 officers assaulted with about three-quarters of these assaults - 33,000 assaults - leading to no injuries. This data shows the number of officers assaulted, not unique officers, so an officer can potentially be included in the data multiple times if they are assaulted multiple times over a year. A little under a quarter of assaults lead to officer injury with most of these from unarmed offenders. Interestingly, there are far more gun and knife assaults where the officer is not injured than where the officer is injured. There are likely cases when the offender threatens the officer with the weapon but does not shoot or stab the officer.
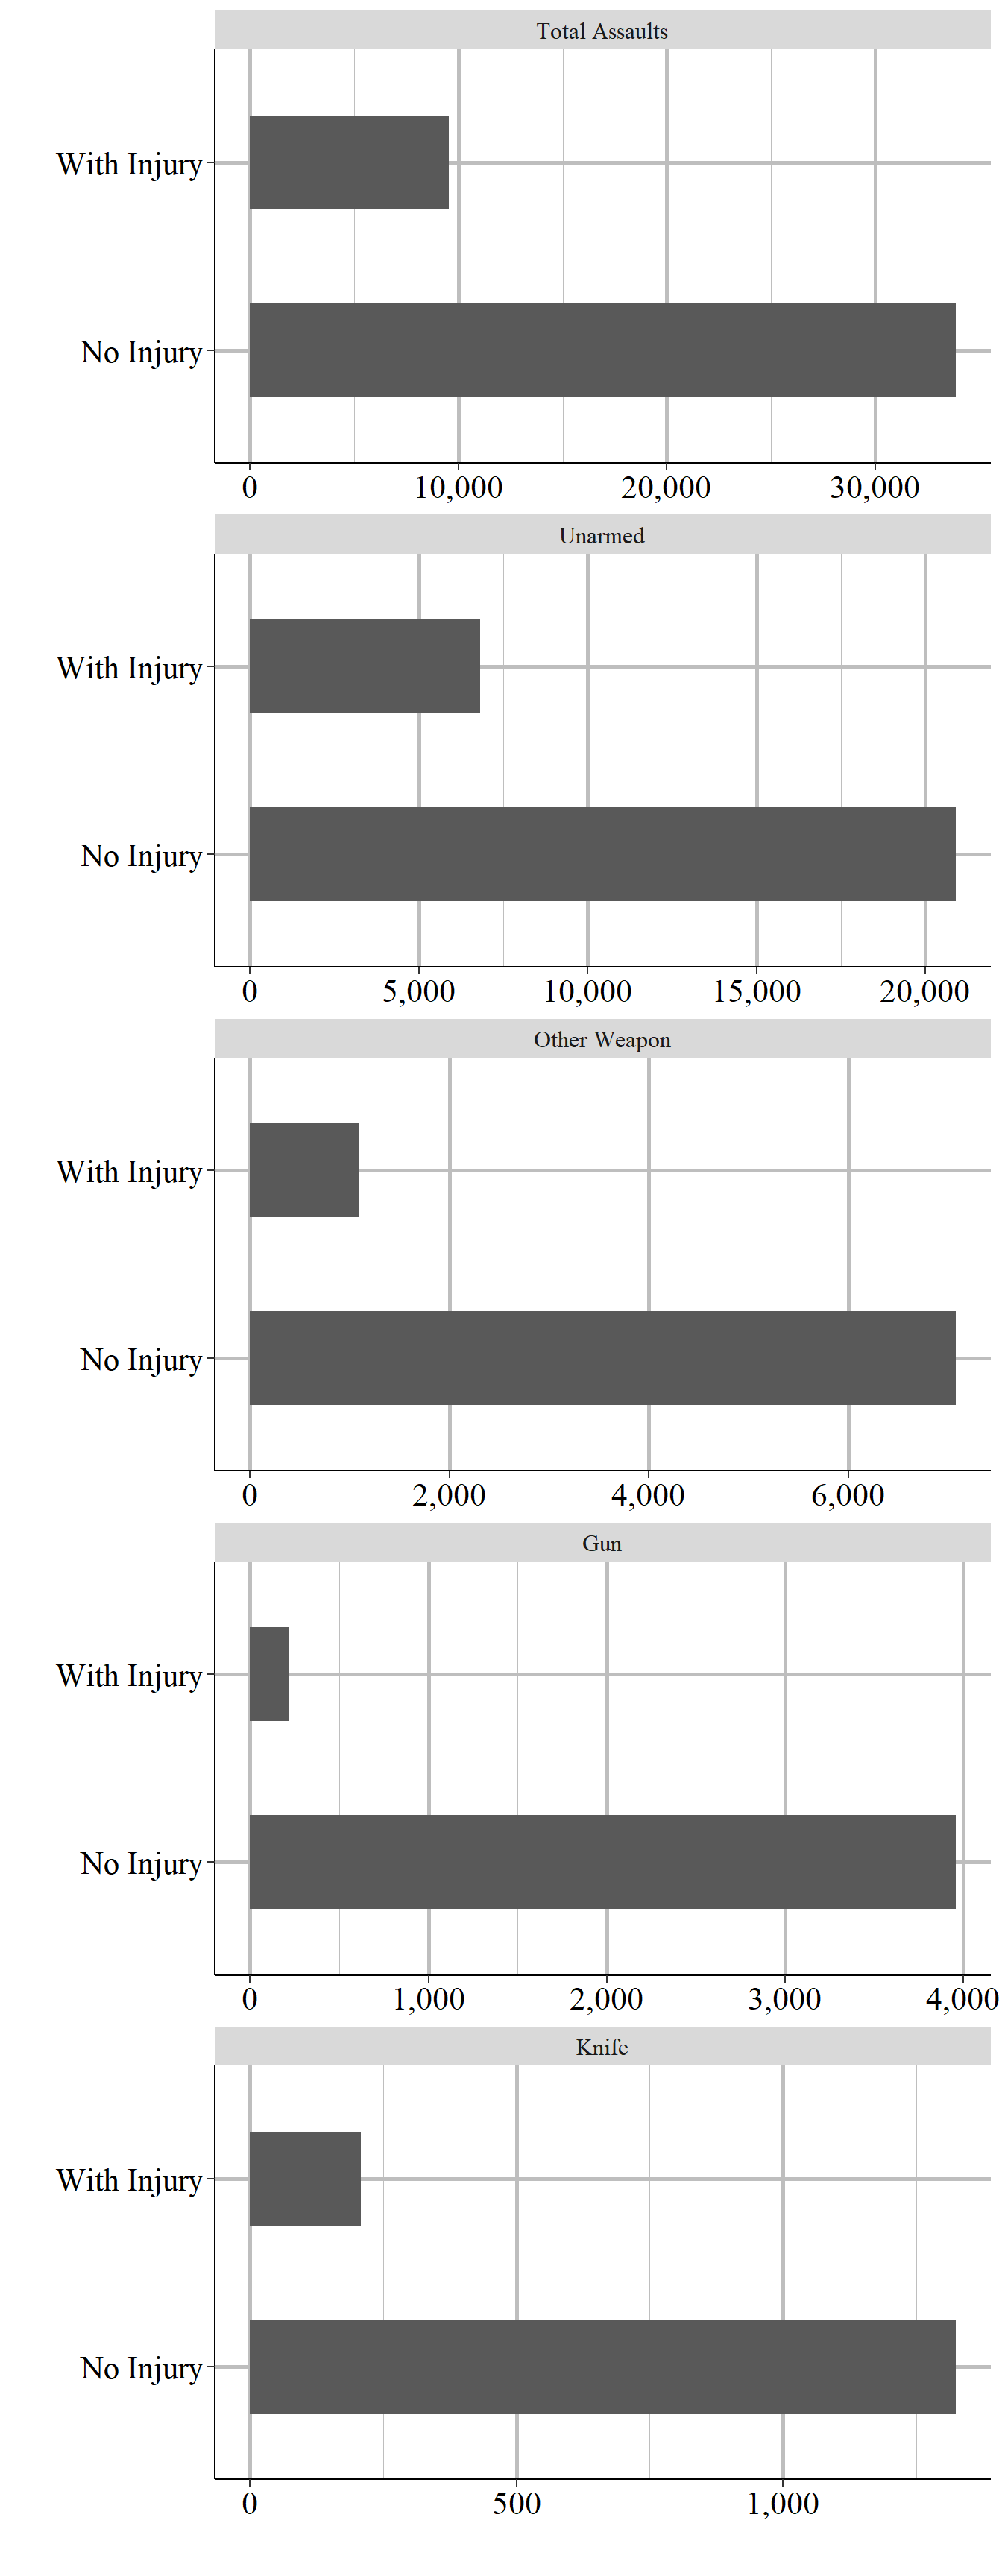
Figure 7.7: The total number of assaults on officers by injury sustained and offender weapon in Los Angeles, 1960-2023.
We can also look at assaults over time. Figure 7.8 shows the number of assaults, assaults with injury, and assault without injury for the Los Angeles Police Department from 1960 to 2018. We can immediately see some data issues are there are years with no assaults recorded. And in the late-2000s there is a sudden drop from about 250 assaults with injuries per year in the previous few decades to nearly zero officer injuries reported a year. This strongly suggests some change in reporting rather than a true decrease in assaults with injuries. For the decades where the data is less obviously wrong, there is a consistent trend of most assaults leading to no injuries, though the distance between the number of injury and non-injury assaults fluctuates over time.
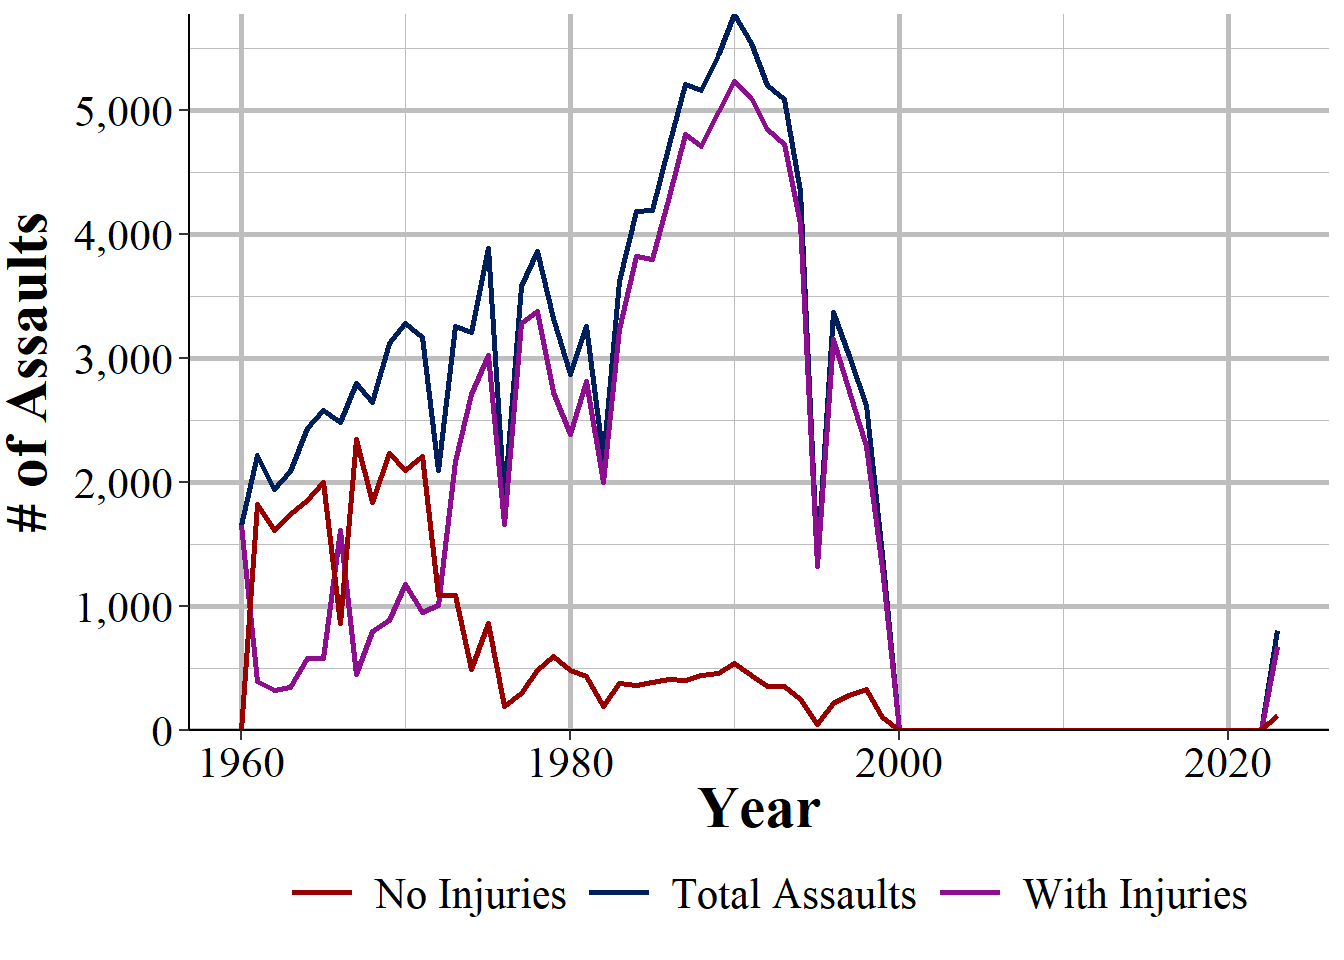
Figure 7.8: The annual number of assaults on officers by injury sustained in New York City, 1960-2023.
7.2.4 Assaults by call type
The next group of ways that assaults are broken down is by the type of call the officer is assigned when they are assaulted. For example, if an officer is responding to a burglary report, any assault they experience on that call will be classified as “burglary” related. In addition, we know how many assaults were cleared by arrest or cleared through exceptional means (for more on this, please see Section 3.4.2) though it does not differentiate between the two. Since assaults are based on the number of officers assaulted, not the number of incidents where officers are assaulted, arresting a single person can clear multiple assaults. The possible call types are below:
- Disturbance call (e.g. domestic violence, person carrying a gun in public)
- Burglary
- Robbery
- Officers arresting someone for another crime
- Civil disorder
- Officer has custody of prisoners
- Suspicious persons
- Officers are ambushed
- Mentally deranged person
- Traffic pursuit and traffic stops
- All other call types
- Total - sum of all call types
Figure 7.9 shows the number of assaults on Los Angeles Police Department officers by the type of call for 1960-2023. There were about 41,000 assaults against Los Angeles Police Department officers with a little over 33,500 of these assaults cleared. An important thing to note is that the number of assaults here is less than the nearly 43,000 assaults for the same agency over the same time period we saw in Figure 7.7. This is because some variables are not reported for all years and agencies are free to report which variables they want to report in any given year. This makes it massively tricky to use this data since even simple statistics for the same agency for supposedly the same variable (here it is technically different variables but should still be the total number of officers assaulted) can be different.
The most common type of call where officers are assaulted are disturbance calls which include domestic violence and reports of dangerous individuals such as people carrying guns in public. The least common call type is ambush calls, though in these calls the police are called to a scene by the offender who intends to assault or kill the officers, so is likely far more dangerous than other call types, even though it is rare.
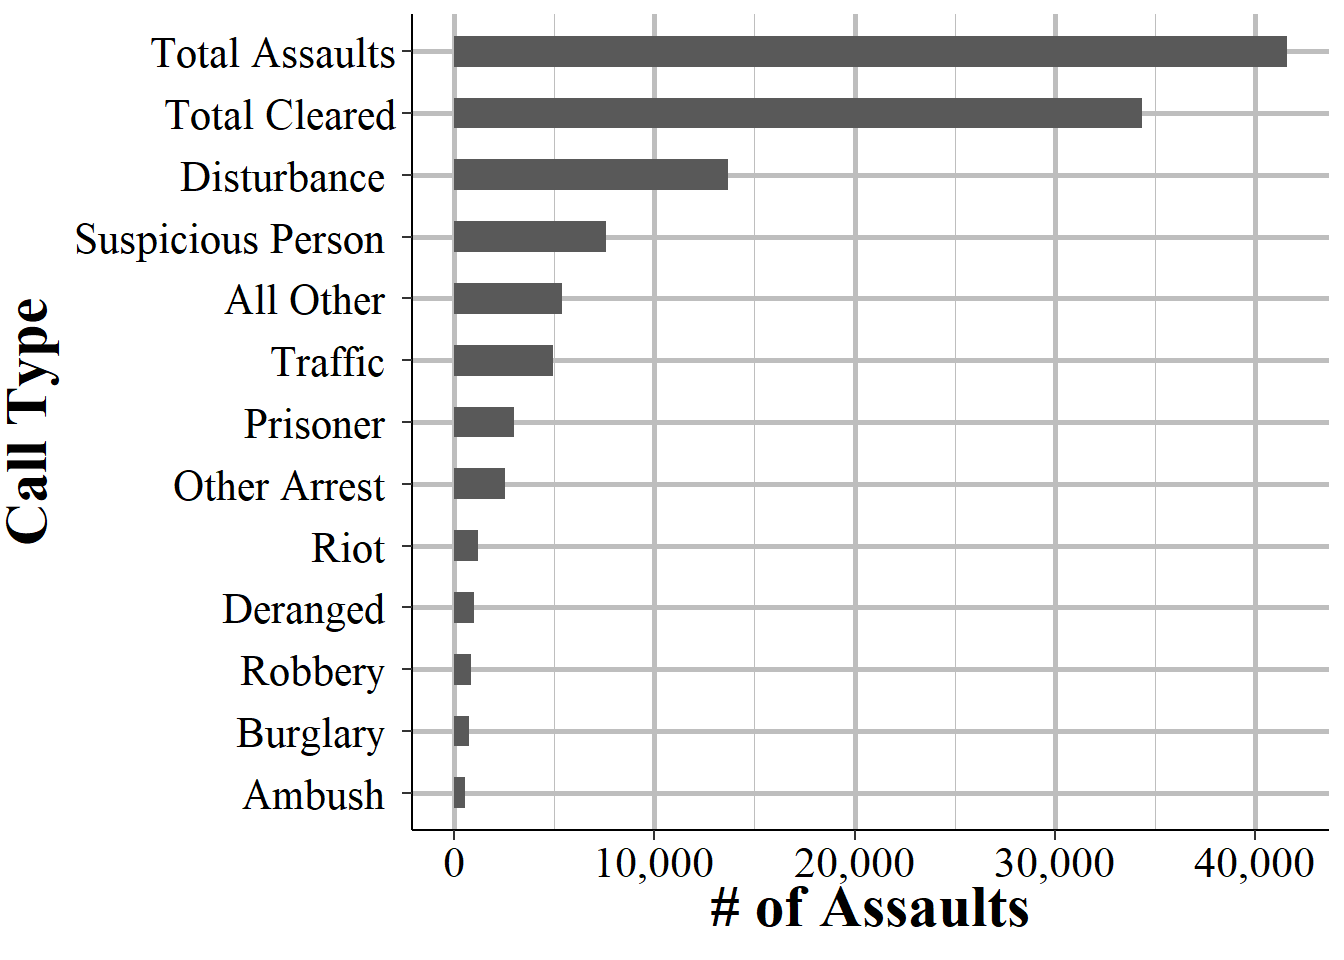
Figure 7.9: Assaults on Los Angeles Police Department officers by type of call where they were assaulted at, 1960-2023.
Within these call types is also a breakdown by offender weapon use, with the same weapons as above, and the type of officer assignment which is essentially if they are alone or not and if they are on foot or not. Finally, it says how many assaults are cleared by arrest or cleared through exceptional means, though it does not differentiate between the two. The shift assignment is essentially how they go through their normal day, if this is in a vehicle, alone, as a detective, or under a different assignment (including being off-duty). For example, being in a vehicle with two officers means that their normal assignment is driving in a vehicle, not that they were actually assaulted in said vehicle. This also does not necessarily mean that these are the only officers at the scene. It is simply the shift assignment of the officer who is assaulted. For example, if an officer who normally works alone in a vehicle shows up to a scene where other officers are present, and who are under different shift assignments, and gets assaulted - and no one else gets assaulted - that is an assault for officers “in a vehicle alone”.
- Offender weapons
- Offender has firearm
- Offender had knife
- Offender had other weapon
- Offender was unarmed
- Type of officer shift assignment
- In a vehicle with two officers
- In a vehicle alone
- In a vehicle alone but assisted by other officers
- Detective or special unit alone
- Detective or special unit assisted by other officers
- Other assignment alone
- Other assignment assisted by other officers
- Number of assaults on police cleared
We will look specifically at disturbance calls since they are the most common call type, at least for the Los Angeles Police Department. Figure 7.10 shows the total number of disturbance assaults by offender weapon in Los Angeles. Most assaults have an unarmed offender with a sharp decline to the number of offenders with a weapon other than a gun or knife. Assaults by a gun and by a knife are the least common.
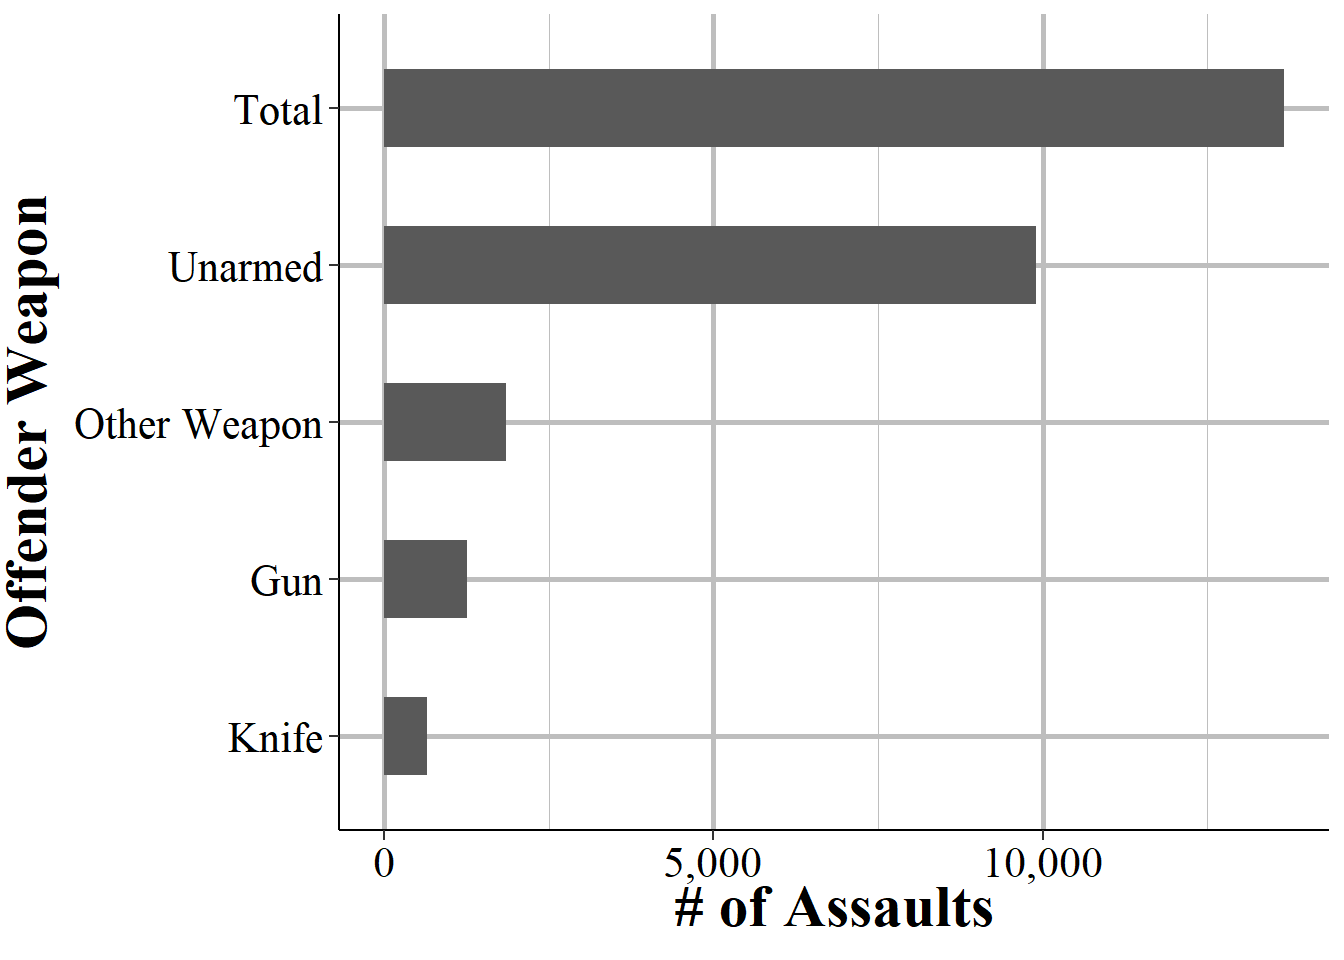
Figure 7.10: The number of assaults on Los Angeles Police Department officers in disturbance calls by the injury sustained by the officer, 1960-2023.
Again using disturbance calls for the Los Angeles Police Department, we can look at assaults by the officer assignment, as seen in Figure 7.11. In the vast majority of assaults it is of officers who are in a vehicle along with a partner. This drops very sharply to several hundred assaults on detectives who are assisting other officers and then increasingly declines to the other shift assignments to the least common assault being against detectives who are acting alone. So are officers in two-man vehicles are much higher risk of assaults than officers alone or of detectives? Almost certainly not. To determine the risk for officers we need to know how officers are generally deployed. If the vast majority of officers are in two-man cars then it makes sense that the vast majority of assaults are on these assignments. Like most FBI data - and most crime data in general - we have the numerator (in this case the number of assaults by shift assignment type) and do not have a proper denominator (such as the distribution of shift assignments for all LAPD officers) to determine a rate of risk. Without this we can present some descriptive statistics but cannot be more useful by determining, for example, if officers in certain shift assignments are at higher risks of being assaulted.
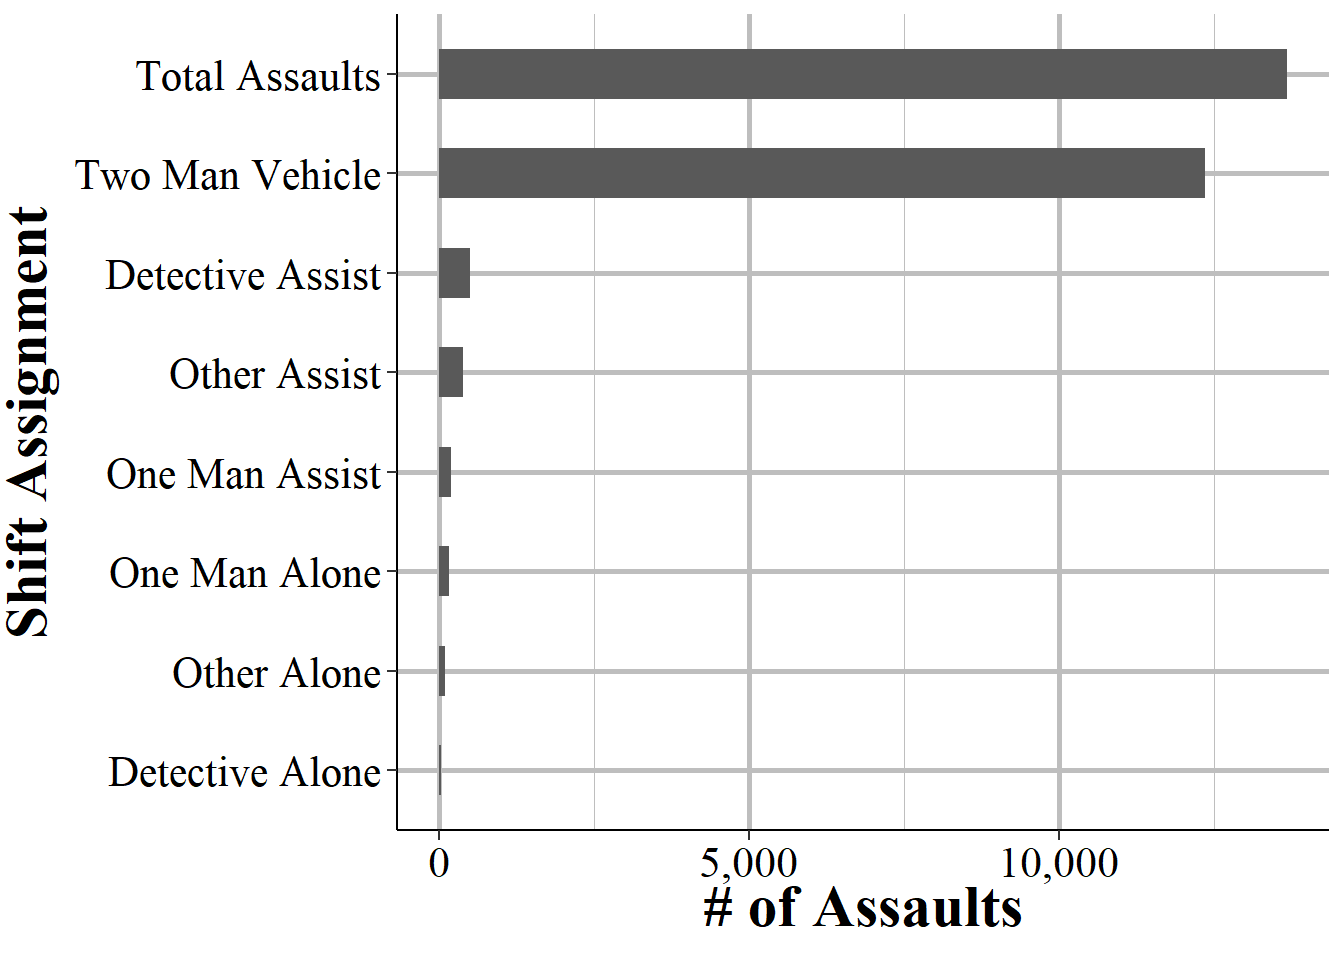
Figure 7.11: The number of assaults on Los Angeles Police Department officers in disturbance calls by the injury sustained by the shift assignment of the officer, 1960-2023.
7.2.5 Assaults by time
The final breakdown in assaults is by the time they occur, divided into 12 two-hour chunks starting at 12:01am. Like some other variables this data is only available starting in 1971. There is no more information than total assaults in this time so we do not know if the assaults led to injuries, the type of call or shift assignment the officer was on, or the offender’s weapons.
- 12:01am - 2:00am
- 2:01am - 4:00am
- 4:01am - 6:00am
- 6:01am - 8:00am
- 8:01am - 10:00am
- 10:01am - 12:00pm
- 12:01pm - 2:00pm
- 2:01pm - 4:00pm
- 4:01pm - 6:00pm
- 6:01pm - 8:00pm
- 8:01pm - 10:00pm
- 10:01pm - 12:00am
We will look at these time chunks in Figure 7.12 which shows the total number of assaults by time of day from 1971 to 2018 in Phoenix, Arizona. The most common times for officers to be assaulted looks pretty similar to when crime is highest: late night and early morning. The 12:01am to 2am chunk is the most common time followed by 10pm to midnight, with assaults increasing at the day grows later and at its lowest point from 6-8am. This strongly suggests that officers are assaulted at crime scenes, such as responding to crimes or making arrests.58
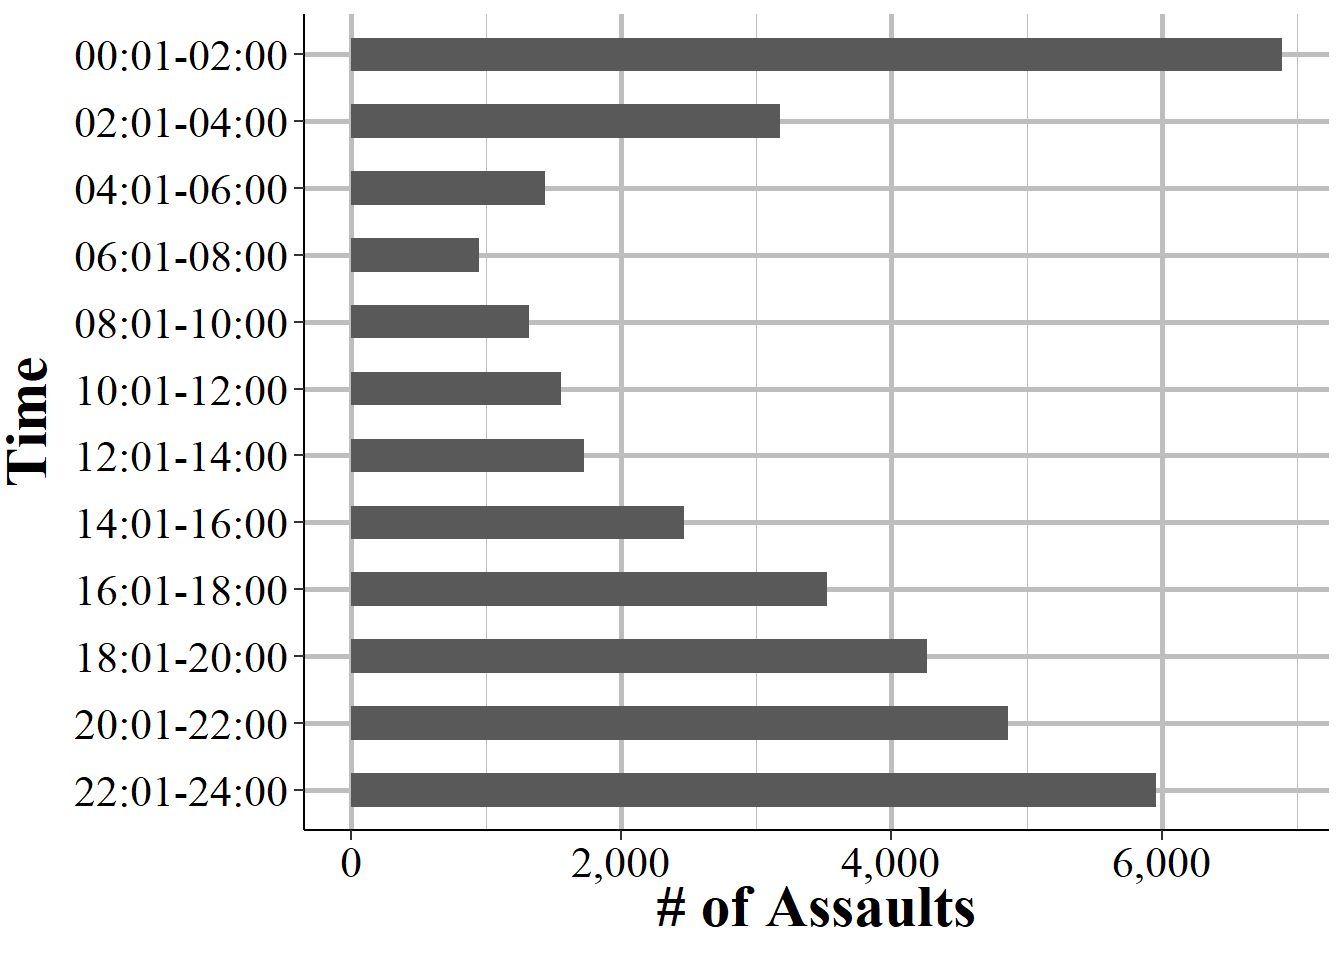
Figure 7.12: The number of assaults against Phoenix Police Department officers by hourly grouping for all years with data available, 1971-2018.
This returns us to the low point of historical collection all the back in the 1960s.↩︎
Of course what happens nationally may be reflected locally, but there is no good reason to focus on national data in lieu of local data.↩︎
The last time I heard, which was several years ago, patrol officers in Philadelphia still had to write up certain reports using typewriters. So tech apparently is still about 1960 level.↩︎
Please note that since Philly did not report in 2021 the 2021 value is NA, and is shown in the figure as the 2020 data point drawing a straight line to the 2022 data point.↩︎
The vast majority of officers who died in 2021 died from Covid.↩︎
In the chapters on NIBRS I will argue against placing too much trust about time which includes midnight, such as the 12:01am to 2am chunk here, because there is evidence that some agencies may use it as the default time when the true time is unknown. That probably happens here as well. While in nearly every officer assault the time should be known, there may still be instances where the reported time is unknown, such as an officer being assaulted at a certain time but forgetting to mark it when entering the report.↩︎